Revista IECOS, 24(2), 61-78
BINARY REGRESSION MODEL WITH MISCLASSIFICATION AND BERKSON-TYPE MEASUREMENT ERROR WITH STUDENT-t DISTRIBUTION
MODELO DE REGRESIÓN BINARIA CON MALA CLASIFICACIÓN Y ERROR DE MEDICIÓN TIPO BERKSON CON DISTRIBUCIÓN T-STUDENT
Marcos
Antonio Alves Pereira![]() 1,
Betsabé Grimalda Blas Achic
1,
Betsabé Grimalda Blas Achic![]() 2
2
[1]Universidad Federal do Cariri, Céará, Brasil
2Universidad Federal de Pernambuco, Pernambuco, Brasil
E-mail: 1marcos.pereira@ufca.edu.br, 2 betsabe@de.ufpe.br
1https://orcid.org/0000-0002-9555-4385, 2https://orcid.org/0000-0002-1236-0930
https://doi.org/10.21754/iecos.v24i2.2003
Recibido (Received): 09/12/2023 Aceptado (Accepted): 20/12/2023 Publicado (Published): 31/12/2023
ABSTRACT
In this article, we introduce a regression model tailored for fitting binary data affected by misclassification in the response variable and Berkson-type measurement error in the covariate. The conventional assumption of a normal distribution for measurement error may inadequately represent atypical observations present in the dataset. To address this limitation, our model incorporates misclassification in the response variable and Berksontype measurement error, employing the Student-t distribution for more robust modeling of these atypical observations. We utilize the cumulative distribution function from the Student-t distribution as the link function, enhancing our ability to capture the dataset’s unique characteristics. Model parameters are estimated via the maximum likelihood method. We conduct a comprehensive Monte Carlo simulation study to thoroughly assess the impact of measurement errors and misclassification. Additionally, we apply the proposed model to a real-world dataset of survivors from the atomic bombing in Japan, showcasing its adaptability and suitability in practical scenarios. Our findings highlight the robustness and flexibility of this model in effectively handling complex binary regression scenarios involving measurement errors and misclassification.
Keywords. Binary regression model; Berkson-type error; misclassification; Student-t
distribution.
RESUMEN
En este artículo, presentamos un modelo de regresión diseñado para ajustar datos binarios afectados por error de clasificación en la variable respuesta y error de medición tipo Berkson en la covariable. La suposición convencional de distribución normal para el error de medición puede representar inadecuadamente observaciones atípicas presentes en el conjunto de datos. Para abordar esta limitación, nuestro modelo incorpora error de clasificación en la variable respuesta y error de medición tipo Berkson, empleando la Distribución t de Student para modelar de manera más robusta estas observaciones atípicas. Utilizamos la función de distribución acumulativa de la distribución t de Student como la función de enlace, mejorando la capacidad para capturar las características únicas del conjunto de datos. Estimamos los parámetros del modelo mediante el método de máxima verosimilitud. Realizamos un estudio exhaustivo de simulación de Monte Carlo para evaluar minuciosamente el impacto de los errores de medición y el error de clasificación. Además, aplicamos el modelo propuesto a un conjunto de datos reales de sobrevivientes del bombardeo atómico en Japón, demostrando su adaptabilidad y adecuación en escenarios prácticos. Nuestros resultados resaltan la robustez y flexibilidad de este modelo en el manejo efectivo de escenarios de regresión binaria complejos que involucran errores de medición y error de clasificación.
Palabras claves: Modelo de regresión binaria, error del tipo Berkson, error de clasificación, Distribución t-Student.
1. INTRODUCCIÓN
In regression models applied to binary data, it is typical to encounter datasets where certain covariates remain unobserved, leading to biased estimates. Conventional binary regression models operate under the assumption that the observed binary responses are devoid of misclassification, and the independent variables are free from measurement error. However, practical scenarios often involve measurement errors and misclassification, contributing to potential biases and imprecisions in the estimated regression coefficients.
To address these challenges, researchers have proposed various methods to account for measurement error in binary regression models and misclassification in the outcome variable in binary regression models. One approach to tackle measurement error is to assume a known distribution for the measurement errors and estimate the regression parameters using likelihoodbased methods. This approach, known as the classical measurement error model, has been extensively studied and applied in various fields, including epidemiology, social sciences, applied social sciences, and environmental sciences. By explicitly modeling the measurement error, it becomes possible to obtain more reliable estimates of the true underlying relationships between variables (Carroll et al., 2006).
Another approach is to model misclassification in the response variable, where the observed binary response may not accurately represent the true underlying response due to misclassification errors. This can be addressed by estimating the probabilities of misclassification and adjusting the model accordingly Ekholm and Palmgren (1982). Carroll et al. (1984) analyzed data from a prospective study on the development of cardiovascular diseases presented in Kannel and Gordon (1968) and demonstrated the impact of measurement errors in binary regression. Burr (1988) investigated measurement errors in Berkson-type covariates in the field of bioassays, employing the probit link function.
In the context of binary response variables, measurement error models become even more challenging due to the presence of misclassification. Several researchers have proposed some models, such as Roy et al. (2005) who developed a measurement error model for misclassified binary responses, where the independent variable is subject to the Berkson-type measurement error which follows the normal distribution. To address departures from normality in measurement errors, Bolfarine and Lachos (2006) considered structural measurement errors following a skew-normal distribution and adopted the probit link function. They employed both classical and Bayesian approaches for parameter estimation, utilizing Markov chain Monte Carlo techniques. Liu and Zhang (2017) conducted a Monte Carlo simulation study with the logistic regression model, employing the logit link function within the classical framework, to demonstrate the presence of non-ignorable biases in parameter estimates when misclassification is disregarded. Bazán et al. (2014) used skew-probit link functions because it deviates from the probit link function in terms of a flexible asymmetry parameter, with Bayesian approach.
In this article, we introduce an innovative regression model designed to tackle the complexities of both measurement error and misclassification in binary data. Berkson-type measurement error occurs when an independent variable isn’t directly observed but is derived from a surrogate variable along with measurement error (Roy et al., 2005; Burr, 1988). The conventional assumption of a normal distribution for measurement error often fails to adequately represent unusual observations within the dataset. To address this limitation, we present a flexible modeling framework integrating the Student-t distribution (Lange et al., 1989) to handle the measurement error component.
Moreover, our model incorporates the cumulative distribution function (cdf) from the Student-t distribution as the link function. This link function plays a pivotal role in connecting the linear predictor to the probabilities of the binary response. By employing the cdf from the Student-t distribution as a link function, we enhance our ability to effectively capture the data’s unique characteristics and thereby improve the model’s overall performance.
For estimating model parameters, we utilize the maximum likelihood method, leveraging the optimx (Nash & Varadhan, 2011) library within the R software (R Core Team, 2021). This method ensures efficient and consistent estimators. Additionally, we conduct a comprehensive Monte Carlo simulation study to evaluate how measurement errors and misclassification impact parameter estimation and prediction accuracy. This study provides insights into the model’s robustness under various scenarios involving complex data structures.
To showcase the practical application of our proposed model, we applied it to a genuine dataset featuring survivors of the atomic bombings in Japan. Our analysis of this dataset serves to underscore the model’s aptness and effectiveness in capturing the intricacies within the data, offering valuable insights and demonstrating its robustness in handling real-world complexities.
The remainder of the article is organized as follows. In Section 2, we present the proposed regression model that incorporates misclassification and measurement error. We estimate the model parameters numerically using the maximum likelihood method. Section 3 provides a simulation study to evaluate the performance of the maximum likelihood estimators. In Section 4, we apply the proposed model on a real data set of survivors of the atomic bomb attacks in Japan. Finally, Section 5 presents concluding remarks.
2. THE MODEL
The probit model, a binary linear regression using the probit link function, assumes the response variable follows a binary distribution. It models the relationship between predictors and the probability of the outcome. The probit link function is the cdf of the standard normal distribution, transforming the linear predictor into a probability, ensuring a smooth and symmetric relationship between predictors and the likelihood of success.
Using the cdf offers interpretability advantages. Coefficients estimate the change in the odds of success for a one-unit change in the predictor, making the probit model more interpretable than other link functions. It assumes errors follow a standard normal distribution, typically reasonable for large sample sizes due to the central limit theorem, resulting in reliable estimates and accurate inference.
However, the probit model is just one option among others (e.g., logit, cloglog) for modeling binary responses. The choice of link function relies on factors like the research context, data characteristics, and specific research questions. Researchers often compare different link functions, selecting the one best fitting the data and yielding the most meaningful results.
We present a regression model tailored for binary data handling Berkson-type measurement errors in covariates, where the error follows a Student-t distribution, including it as the link function. Furthermore, we account for misclassification in the response variable.
In linear models with binary responses, average estimates represent proportions. Various link functions are employed to transform the linear predictor, mapping values from the real line to the interval [0, 1]. Consequently, a binary regression model can be defined as
![]()
Where
![]() is the link
function,
is the link
function, ![]() is the binary
response variable with Bernoulli distribution and parameter
is the binary
response variable with Bernoulli distribution and parameter ![]() is the model
parameter vector, and
is the model
parameter vector, and ![]() is the predictor
variable,
is the predictor
variable, ![]() We consider the
link function to be the cdf of a distribution
We consider the
link function to be the cdf of a distribution ![]() belonging to the
Student-t distribution (Lange et al., 1989) with location parameter 0, scale
parameter 1 and
belonging to the
Student-t distribution (Lange et al., 1989) with location parameter 0, scale
parameter 1 and ![]() degrees of
freedom. Thus,
degrees of
freedom. Thus, ![]() which implies
that
which implies
that ![]()
· Naive model (M1)
For
the naive model, which assumes an absence of misclassification and measurement
error, we consider the parameter vector to be estimated as ![]() . The probability
of observing
. The probability
of observing ![]() , denoted as
, denoted as ![]() for
for ![]() is
given by
is
given by
(2)
![]()
and is based on
the responses ![]() and the predictors
and the predictors
![]() with
with ![]() The likelihood
function for the M1 model is given by
The likelihood
function for the M1 model is given by
So, we will have the log-likelihood function is then obtained as
which represents the log-likelihood function for the M1 model, considering (2) and (3), we have
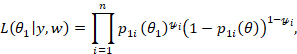
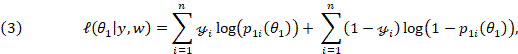
· Model incorporating misclassification (M2)
Let
![]() represent the
unobserved or true binary response, and
represent the
unobserved or true binary response, and ![]() denote the
observed binary response. We assume that the probabilities
denote the
observed binary response. We assume that the probabilities ![]() of
misclassification (Roy et al., 2005) are
of
misclassification (Roy et al., 2005) are
(5)
![]()
Where ![]()
Considering ![]() with a Bernoulli
distribution parameterized by
with a Bernoulli
distribution parameterized by ![]() we have
we have
(6)
![]()
A
regression model for binary data with misclassification, where the parameter
vector is denoted as ![]() given the
predictors
given the
predictors ![]() is represented by
the log-likelihood function
is represented by
the log-likelihood function
(7)
where
![]() are the observed
responses.
are the observed
responses.
· Model considering measurement error effects (M3)
In
the regression model with Berkson-type measurements error, the predictor
variable ![]() is not directly
observed. Instead,
is not directly
observed. Instead, ![]() is obtained as
the sum of its surrogate
is obtained as
the sum of its surrogate ![]() and a measurement
error
and a measurement
error ![]() with
with ![]() and
and ![]() Specifically, we
have
Specifically, we
have
(8)
![]() (Probability of
(Probability of ![]() given
given ![]() )
)
(9)
![]() (Measurement
error model)
(Measurement
error model)
Assuming
that the random variables ![]() and
and ![]() are univariate
and independent random variables that constitute the random vector with
bivariate Student-t distribution
are univariate
and independent random variables that constitute the random vector with
bivariate Student-t distribution
(10)
![]()
where
![]() and
and ![]() then we can
define the random variable
then we can
define the random variable ![]() (Branco &
Dey, 2001; Lin, 1972).
(Branco &
Dey, 2001; Lin, 1972).
For
the regression model with binary response with measurement error Berkson-type
(8)-(9), considering ![]() where
where ![]() we have
we have
(11)
![]()
where
![]() is the link
function
is the link
function ![]() follows a
Student-t distribution with location parameter
follows a
Student-t distribution with location parameter ![]() , scale parameter
, scale parameter ![]() and
and ![]() degrees
of freedom and
degrees
of freedom and ![]() is the cdf of
is the cdf of ![]()
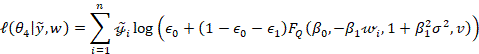
A
model for binary data with Berkson-type measurements error, with the parameter
vector ![]() , has the
log-likelihood function given by
, has the
log-likelihood function given by
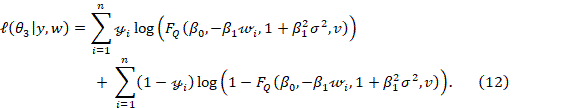
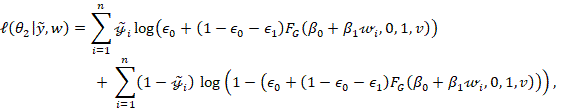
· Model incorporating both measurement error and misclassification (M4)
We
delineate a model that integrates both measurement error and misclassification,
building upon the foundations laid by the M2 (6) and M3 (11) models. We
consider the probabilities ![]() and
and ![]() of
misclassification.
of
misclassification.
Given
the parameter vector ![]() and denoting the
unobserved binary response as the true value
and denoting the
unobserved binary response as the true value ![]() , the observed
binary response as
, the observed
binary response as ![]() , and the observed
variable as
, and the observed
variable as ![]() the
log-likelihood function is expressed as
the
log-likelihood function is expressed as

3. SIMULATION STUDY
We performed a series of Monte Carlo simulations to examine the effects of misclassification and measurement errors on the coefficient estimates of regression models. In each scenario, we generate 500 Monte Carlo with measurement error following a Student-t distribution and/or with misclassification. Below, we provide a description of the simulation study, mirroring the approach taken by Roy et al. (2005).
1.
We generate the variable ![]() with uniform
distribution in the interval (-4,4) and these values are kept fixed.
with uniform
distribution in the interval (-4,4) and these values are kept fixed.
2.
We generate the variable ![]() , where
, where ![]() with
with ![]() and
and ![]() following
Student-t distributions with
following
Student-t distributions with ![]() degrees of
freedom, i. e.,
degrees of
freedom, i. e., ![]() and
and ![]()
3.
We generate the variable ![]() with Bernoulli
distribution and probability of success
with Bernoulli
distribution and probability of success ![]() with
with ![]() according to the
scenario considered and with
according to the
scenario considered and with ![]() and
and ![]()
4.
We generate the variable ![]() with
misclassification with probabilities prefixed as (5).
with
misclassification with probabilities prefixed as (5).
5.
We fit the generated data ![]() with the models
M1, M2, M3 e M4 presented to estimate the parameters using the maximum
likelihood method.
with the models
M1, M2, M3 e M4 presented to estimate the parameters using the maximum
likelihood method.
6.
Repeat steps 2-5 for 500 replicas and find the estimates ![]() and
and ![]() and find the
standard errors of
and find the
standard errors of ![]() through Fisher’s
information matrix.
through Fisher’s
information matrix.
7.
Calculate the average of ![]() and
and ![]() and the average
of standard errors.
and the average
of standard errors.
8.
Repeat steps 2-7 for different values of ![]() and
and ![]() .
.
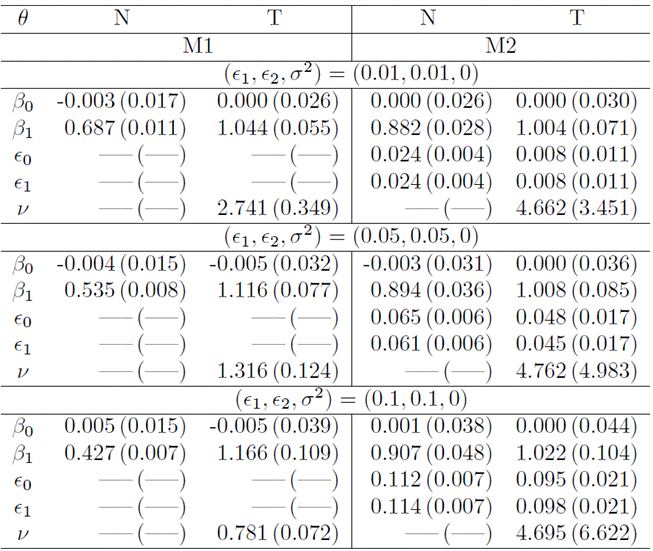
Table
1-3 display the outcomes of simulations, featuring mean values and standard
errors (SE) statistics for the adjusted model parameters. The results are
derived from 500 Monte Carlo samples, each comprising 10, 000 observations,
considering the presence of measurement and/or classification errors.
Additionally, for the sake of comparison, adjustments were made using the
probit link function (Roy et al., 2005) for models M1, M2, M3, and M4. This
involved substituting the cdf of the Student-t distribution (T) with that of
the normal distribution (N). Throughout all scenarios, ![]() is assumed to be
known.
is assumed to be
known.
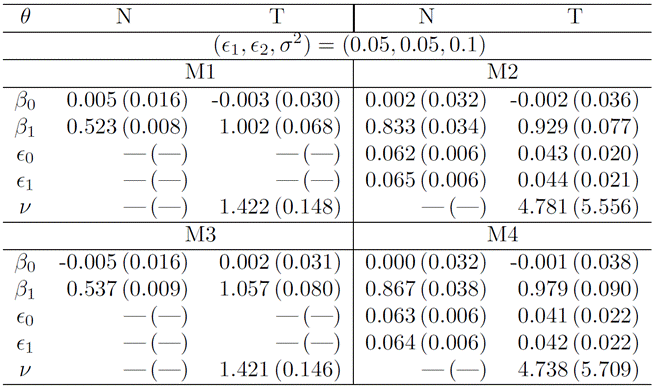
In Table 1, showcasing simulation results where data exclusively incorporated misclassification, we note smaller biases in adjustments employing the Student-t distribution in contrast to adjustments with the normal distribution. This pattern holds true when comparing models M2 and M1. The superiority of the M2 model with Student-t becomes more pronounced with escalating probabilities of misclassification, as expected. Notably, the Student-t degrees of freedom estimated with the M1 model are significantly smaller than those estimated with M2, emphasizing the need for a distribution with heavy tails, particularly since M1 does not factor in misclassification. Additionally, it’s worth mentioning that the SEs of M2 are larger due to the incorporation of additional parameters into the model.
Table1
The mean and SE of model parameters for M1 and M2 are derived from 500 Monte Carlo samples, each comprising 10, 000 observations. The data were generated with misclassification and without measurement error in three distinct scenarios.
In
Table 2, we present simulation results based on data generated to incorporate
measurement error. The models utilizing the Student-t distribution stand out,
demonstrating superior performance with the smallest biases. Notably, as we
increase ![]() , all models
exhibit a noticeable rise in bias in estimating
, all models
exhibit a noticeable rise in bias in estimating ![]() . This trend is
similarly observed concerning ν when employing the Student-t distribution.
. This trend is
similarly observed concerning ν when employing the Student-t distribution.
Table 2
The mean and SE of model parameters for M1 and M3 are calculated from 500 Monte Carlo samples, each comprising 10, 000 observations. The datasets were generated to include measurement error and exclude misclassification in three distinct scenarios.
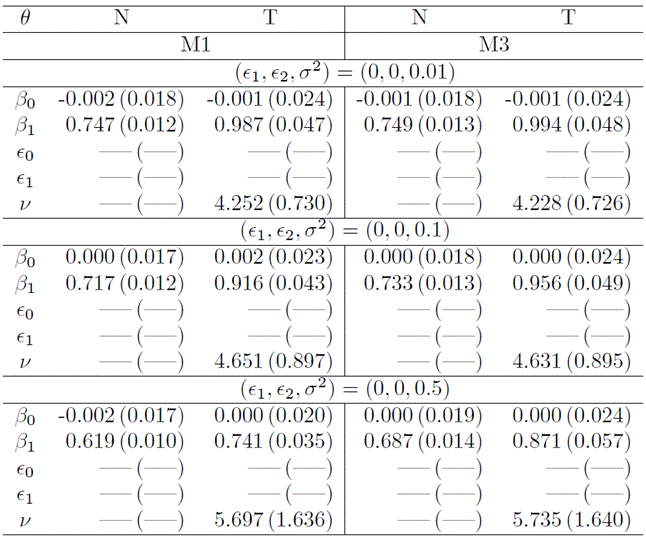
Table 3
The mean and SE of parameters for models M1, M2, M3, and M4 are computed from 500 Monte Carlo samples, each with a size of 10, 000, generated to incorporate both measurement error and misclassification.
Table
3 highlights that models utilizing the Student-t distribution generally yield
superior results, exhibiting smaller biases across most scenarios. Notably,
estimates of the parameter ![]() in models M1 and
M3, under the normal distribution, displayed the most significant biases. Additionally,
under the Student-t distribution, the estimated values of ν are
consistently below 2, emphasizing the requirement for a distribution with heavy
tails and rendering adjustments with the normal distribution inappropriate. The
M4 model under the Student-t distribution, on the whole, delivered accurate
estimates for all parameters.
in models M1 and
M3, under the normal distribution, displayed the most significant biases. Additionally,
under the Student-t distribution, the estimated values of ν are
consistently below 2, emphasizing the requirement for a distribution with heavy
tails and rendering adjustments with the normal distribution inappropriate. The
M4 model under the Student-t distribution, on the whole, delivered accurate
estimates for all parameters.
4. APPLICATION
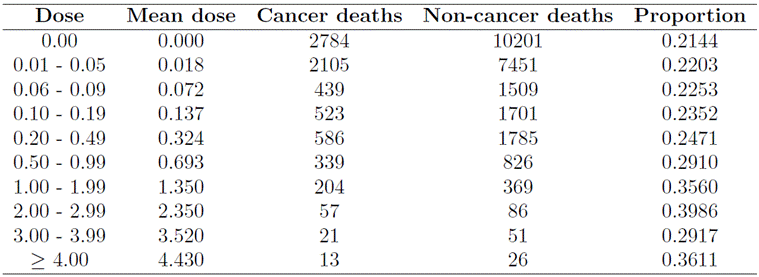
The dataset under examination in this analysis pertains to survivors of the atomic bombings conducted by the United States on the cities of Hiroshima and Nagasaki in Japan. Those who survived or resided in nearby areas experienced the effects of radiation exposure, leading to health issues, including cancer. The data utilized in this study, as sourced from Sposto et al. (1992), originates from a research initiative commenced 5 years after the atomic bombings. The primary objective of this study was to assess the impact of radiation exposure on cancer-related deaths. The cohort consisted of 86,520 survivors of the attacks, categorized into exposed and non-exposed groups based on their proximity to the bomb blast (< 2km, 2 to 10 km). These survivors were monitored from 1950 to 1985.
Table 4 presents information on radiation exposure dose, mean radiation exposure dose, number of cancer deaths, number of deaths from other causes, and the proportion of cancer deaths among the 31, 037 individuals studied. Measurement errors in radiation doses depend on location and biological reasons, as individuals can absorb different amounts of radiation despite having the same exposure conditions. Radiation exposure dose is measured using dosimetry, which quantifies the radiation doses to which an individual (or living being) may be exposed. Data were collected on various types of cancer, including lung, mouth, intestine, breast, prostate, among others. However, the radiation doses absorbed by the intestine at the time of exposure were selected as the reference dose.
Table 4
Number of cancer and non-cancer deaths among the atomic bomb survivors in Hiroshima and Nagasaki corresponding to 10 dose categories.
We
applied the four studied models to fit the dataset, considering the cdf of both
the Student-t (T) and normal (N) distributions as link functions in each model.
For models involving measurement error, the substitute variable wi represents
the average dose observed for each category, while the variable xi represents
the true dose. Thus, we make the assumption that ![]() where
where ![]() and
and ![]() (Roy et al.,
2005),
(Roy et al.,
2005), ![]() The focal point
of this application is to assess the adequacy of the M4 model with Student-t in
describing the data. Table 5 provides the estimated values of the parameters
for models M1, M2, M3, and, M4 along with the corresponding SEs and the
The focal point
of this application is to assess the adequacy of the M4 model with Student-t in
describing the data. Table 5 provides the estimated values of the parameters
for models M1, M2, M3, and, M4 along with the corresponding SEs and the ![]() -values
obtained through Wald statistics.
-values
obtained through Wald statistics.
Table 5
Model
comparison: parameter estimates, SEs, ![]() -values,
AIC and BIC criteria for M1, M2, M3, and M4 fitted to data from atomic bomb
survivor in Hiroshima and Nagasaki, Japan.
-values,
AIC and BIC criteria for M1, M2, M3, and M4 fitted to data from atomic bomb
survivor in Hiroshima and Nagasaki, Japan.
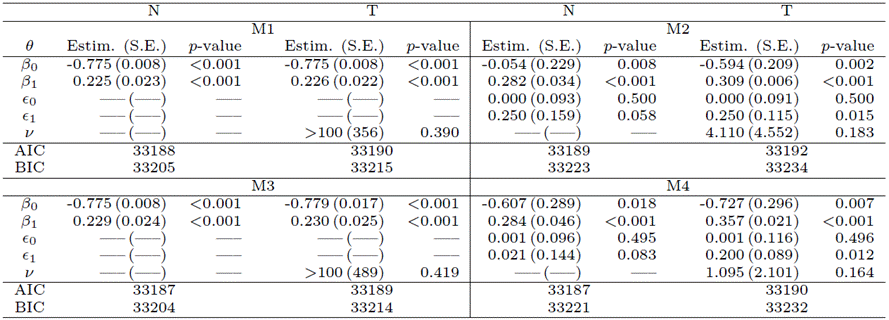
In
the results presented in Table 5, we observed that the estimated values of
parameters for models M1 and M3 are notably similar. The Wald statistics
indicate that the estimated degrees of freedom under the Student-t distribution
are not significant; they are, in fact, zero, suggesting a distribution with
heavy tails for a more appropriate fit. In the case of the M2 model, the
estimated value of ![]() is not
significant when considering the normal distribution at a 0.05 significance
level, but it becomes significant with the Student-t distribution. Similarly, for
the M4 model with the Student-t distribution,
is not
significant when considering the normal distribution at a 0.05 significance
level, but it becomes significant with the Student-t distribution. Similarly, for
the M4 model with the Student-t distribution, ![]() is significant,
but the degree of freedom, as per the Wald test, is not, indicating the
necessity for an adjustment with a distribution featuring heavy tails.
is significant,
but the degree of freedom, as per the Wald test, is not, indicating the
necessity for an adjustment with a distribution featuring heavy tails.
According to the AIC criterion, the most suitable models are M3 and M4 under the normal distribution. Notably, the M3 model with the normal distribution also presents the lowest BIC. Given the observed existence of classification and measurement errors alongside a distribution with heavy tails, we propose the use of the M4 model for this application.
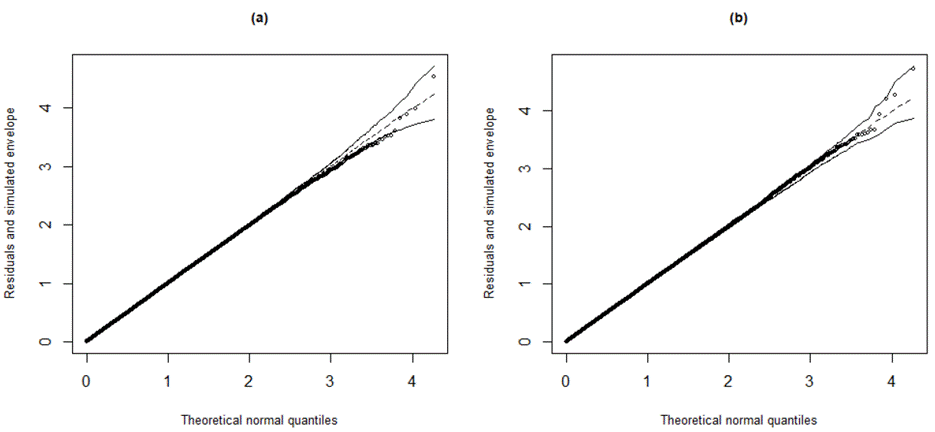
In Figure 1, we present graphs featuring randomized quantile residuals, as proposed by Dunn and Smyth (1996). These residuals tend to converge to the standard normal distribution when the model parameters are estimated consistently (Pereira & Russo, 2019). Additionally, we include their simulated confidence bands, constructed at a 0.95 confidence level using the hnp (de Andrade et al., 2017) library, for both the fit M1 (N) and the more appropriate fit M4 (T). Notably, the simulated envelope graph under the M1 model and the normal distribution appears unsuitable for the dataset. In such cases, the preferred option is adjusting with the M4 model and the Student-t distribution, characterized by heavy tails and accounting for both measurement error and misclassification.
Figure 1
Simulated envelopes for the randomized quantile residuals: (a) M1 normal (b) M4 Student-t
5. CONCLUDING REMARKS
In this study, we adopt the assumption that the measurement error in the covariate adheres to a Student-t distribution, and the binary response is subject to misclassification. Utilizing the cdf of the Student-t distribution as a link function, the M4 model presented in this article proves valuable for modeling the mean of a binary response with both classification and measurement errors in the covariate. This model is particularly suited for adjusting data where the measurement error does not follow a normal distribution.
Parameter
estimation was performed using the maximum likelihood method with the R
software (R Core Team, 2021) and the ![]() (Nash &
Varadhan, 2011) library.
(Nash &
Varadhan, 2011) library.
Simulations
demonstrate the superiority of models considering some form of error and
employing the Student-t distribution compared to the M1 model and models with
the normal distribution, especially when ![]() , and
, and ![]() are involved.
Generally, models M2 and M4 exhibit higher SEs due to their greater number of
parameters.
are involved.
Generally, models M2 and M4 exhibit higher SEs due to their greater number of
parameters.
In
the final application, we employed data concerning the health effects on
survivors of the atomic bombings in Hiroshima and Nagasaki in 1945, revealing a
Berkson-type measurement error with a distribution featuring heavy tails. Among
the models studied, it was observed that M1 and M3 provide similar estimates of
coefficients ![]() and
and ![]() . However, the M4
model with the Student-t distribution yields notably different parameter
estimates from the other models. Importantly, considering measurement error and
misclassification observed in the data, the M4 model with the Student-t
distribution emerges as the most suitable choice, supported by Wald statistics
and simulated envelope graphs.
. However, the M4
model with the Student-t distribution yields notably different parameter
estimates from the other models. Importantly, considering measurement error and
misclassification observed in the data, the M4 model with the Student-t
distribution emerges as the most suitable choice, supported by Wald statistics
and simulated envelope graphs.
REFERENCES
Bazán, J. L., Romeo, J. S., & Rodrigues, J. (2014). Bayesian skew-probit regression for binary response data. Brazilian Journal of Probability and Statistics, 28(4), 467-482. https://doi.org/10.1214/13-BJPS218
Bolfarine, H., & Lachos, V. H. (2006). Skew binary regression with measurement errors. Statistics, 40(6), 485-494. https://doi.org/10.1080/02331880600589270
Branco, M. D., & Dey, D. K. (2001). A general class of multivariate skew-elliptical distributions. Journal of Multivariate Analysis, 79(1), 99-113. https://doi.org/10.1006/jmva.2000.1960
Burr, D. (1988). On errors-in-variables in binary regression—Berkson case. Journal of the American Statistical Association, 83(403), 739-743. https://doi.org/10.1080/01621459.1988.10478656
Carroll, R. J., Spiegelman, C. H., Lan, K. G., Bailey, K. T., & Abbott, R. D. (1984). On errors-in-variables for binary regression models. Biometrika, 71(1), 19-25. https://doi.org/10.1093/biomet/71.1.19
Carroll, R. J., Ruppert, D., Stefanski, L. A., & Crainiceanu, C. M. (2006). Measurement error in nonlinear models: a modern perspective. Chapman and Hall/CRC. https://doi.org/10.1201/9781420010138
de Andrade Moral, R., Hinde, J., & Garcia Borges Demétrio, C. (2017). Half-normal plots and overdispersed models in R: the hnp package. Journal of Statistical Software, 81(10). https://doi.org/10.18637/jss.v081.i10
Dunn, P. K., & Smyth, G. K. (1996). Randomized quantile residuals. Journal of Computational and graphical statistics, 5(3), 236-244. https://doi.org/10.1080/10618600.1996.10474708
Ekholm, A., & Palmgren, J. (1982). A model for a binary response with misclassifications. In GLIM 82: Proceedings of the international conference on generalised linear models (pp. 128-143). Springer New York. https://doi.org/10.1007/978-1-4612-5771-4_13
Kannel, W. B., & Gordon, T. (1968). The Framingham Study: an epidemiological investigation of cardiovascular disease. United States. Department of Health, Education, and Welfare, National Institutes of Health.
Lange, K. L., Little, R. J., & Taylor, J. M. (1989). Robust statistical modeling using the t distribution. Journal of the American Statistical Association, 84(408), 881-896. https://doi.org/10.1080/01621459.1989.10478852
Lin, P. E. (1972). Some characterizations of the multivariate t distribution. Journal of Multivariate Analysis, 2(3), 339-344. https://doi.org/10.1016/0047-259X(72)90021-8
Liu, H., & Zhang, Z. (2017). Logistic regression with misclassification in binary outcome variables: a method and software. Behaviormetrika, 44(2), 447-476. https://doi.org/10.1007/s41237-017-0031-y
Nash, J. C., & Varadhan, R. (2011). Unifying optimization algorithms to aid software system users: optimx for R. Journal of Statistical Software, 43, 1-14. https://doi.org/10.18637/jss.v043.i09
Pereira, M. A. A., & Russo, C. M. (2019). Nonlinear mixed-effects models with scale mixture of skew-normal distributions. Journal of Applied Statistics, 46(9), 1602-1620. https://doi.org/10.1080/02664763.2018.1557122
R Core Team, R. (2021). R: A language and environment for statistical computing. R Foundation for Statistical Computing.
Roy, S., Banerjee, T., & Maiti, T. (2005). Measurement error model for misclassified binary responses. Statistics in medicine, 24(2), 269-283. https://doi.org/10.1002/sim.1886
Sposto, R., Preston, D. L., Shimizu, Y., & Mabuchi, K. (1992). The effect of diagnostic misclassification on non-cancer and cancer mortality dose response in A-bomb survivors. Biometrics, 48(2), 605-617. https://www.jstor.org/stable/2532315