Object
P
(days)
width
(days)
depth
Rp/Rs
a/Rs
i
Wasp-80 b


Ref. [8]


A. Pereyra et al.
Exoplanet transits observed at OAUNI
Tránsitos exoplanetarios observados en
el OAUNI
Antonio Pereyra 1,2*, José Ricra 2
1 Instituto Geofísico del Perú, Área Astronomía, Badajoz 169, Ate, Lima, Perú
2 Facultad de Ciencias, Universidad Nacional de Ingeniería, Av. Túpac Amaru 210, Rímac, Lima, Perú
Recibido (Received): 26/ 02 / 2019 Aceptado (Accepted): 06/ 06 / 2019
ABSTRACT
This work present the exoplanet transit program developed at OAUNI on the 2016 and 2017 campaigns. Seventeen exoplanet transits were observed and in six of them more than one event was registered. In a couple of cases the same transit were gathered four times. Preliminary reductions are shown in three transits (WASP-80 b, WASP-52 b, and WASP-77 A b). The associated light curves show well-defined events and their modeling let to infer physical parameters of each system. These measurements are the first ones of their kind collected by a peruvian astronomical facility.
Keywords: photometry, exoplanet transit
RESUMEN
Presentamos el programa de tránsitos exoplanetarios desarrollado en el Observatorio Astronómico de la Universidad Nacional de Ingeniería (OAUNI) durante las campañas 2016 y 2017. Diecisiete tránsitos exoplanetarios fueron observados y en seis de ellos más de una medida en fecha diferente fue posible. En un par de casos el mismo tránsito fue observado cuatro veces. Reducciones preliminares son mostradas en tres tránsitos (WASP-80 b, WASP-52 b, and WASP-77 A b). Las curvas de luz asociadas muestran eventos bien definidos y su modelaje permitió inferir parámetros físicos de cada sistema. Estas medidas son las primeras de su tipo a ser realizadas con datos recogidos desde una facilidad astronómica en suelo peruano.
Palabras clave: fotometría, tránsitos exoplanetarios
Scientific programs in observational astronomy are developed at The National University of Engineering (UNI in spanish) using an astronomical facility (OAUNI [1], [2]) installed at Huancayo, Peru. The exoplanet transit program has collected continuous data since 2016 and a review of the observed targets along with preliminary results is presented in this work. One of the main aims of this program is to verify the feasibility to characterize the physical parameters involved in these events. In this sense, astronomical photometry was extensively used for this purpose.
_________________________
* Corresponding author:
E-mail: apereyra@igp.gob.pe
An exoplanet transit happens when a planet passes in front of its host star observed from the Earth. When the planet is passing a small eclipse occurs and the bright of the star is dimmed for a few percent. This dimming is related to the size ratio between the star and the planet. When a small planet transits a large star, a slight dimming will be noted. On the other hand, a large planet passing in front a small star will produce a greater effect.
Astronomical photometry to detect exoplanet transit is so far the most effective and sensitive method currently available for this purpose. More than eighty percent of the approximately four thousand exoplanet detections up to date used this method [3].
A precise measurement of the size planet can be retrieved from the size ratio between the star and planet when the size of the host star is known by spectroscopy. In addition, when information about the radial velocity is available, the minimum mass of the planet can be used to infer the density planet from the size planet obtained by the transit photometry. As we can see, the combination of several techniques let us to find important physical parameters of the exoplanets studied by transits.
In the following, we present the observations gathered at OAUNI associated to the exoplanet transit program along with preliminary reductions (Sec. 2). The analysis of three interest cases is shown in Sec. 3. The conclusions are drawn in Sec. 4.
The observations were performed using the 0.5m OAUNI telescope [2] at Huancayo during the regular 2016-2017 observational campaigns. A front-illuminated CCD[1] with 3072x2048 pixels and 9µm/pixel was used as detector. The focal ratio f/8.2 of the scope yields a plate scale of 0.45”/pixel and a field-of-view (FOV) of 23’x15’.
The reduction of the digital images was performed in two main steps, with the calibration process followed by aperture photometry. All the images were reduced using IRAF[2] with typical calibration corrections of dark current and flatfield. Special IRAF routines were used to align the sequences of images and aperture photometry (DAOPHOT [4], [5]) was systematically used. We used the differential photometry technique to construct all the light curves showed in this work, where the instrumental magnitude of the interest object is discounted by the instrumental magnitude of one comparison star in the same field of view. Another comparison star is always measured as double checked. In addition, the precision of the measurement can be enhanced if the average of the comparison stars is used in the discount. The large FOV of our detector facilitates to choose the better comparison stars in each case.
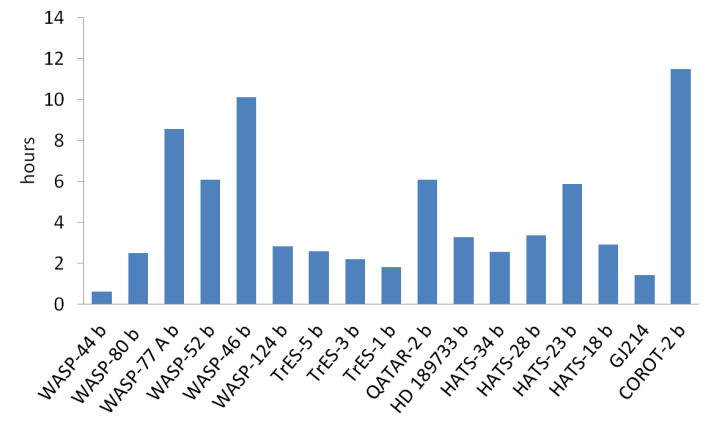
The observation log for 2016-2017 campaigns is shown in Table 1. The observation date using the format yyyymmdd is indicated in Col. (1) with the exoplanet name in Col. (2). The visual magnitude of the host star is shown in Col. (3). All the measurements were observed in R broadband filter as the better compromise between the detector sensibility and the photometric precision required. The individual measurement number in each case is show in Col. (5) with the same integration time (IT= 20s) for all the cases. They are more than 10700 individual measurements distributed in seventeen observed exoplanets (see Fig. 1). This resulted in approximately seventy four observed hours being than in six cases more than one transit in different dates were gathered: WASP-77 A b, WASP-52 b, QATAR-2 b, HATS-23 b, WASP-46 b, and COROT-2 b. In particular, for the last two exoplanets four transits were observed being COROT-2 b the most observed with a total time of ~14h.
Table 1. Observation log for 2016-2017 campaigns.
Date | object | V | N x IT(s) |
20160711 | WASP-44 b | 12.9 | 90 x 20 |
20160712 | WASP-80 b | 11.9 | 360 x 20 |
20160713 | WASP-46 b | 12.9 | 360 x 20 |
20160802 | WASP-46 b | 12.9 | 356 x 20 |
20160803 | WASP-52 b | 12.0 | 427 x 20 |
20160803 | QATAR-2 b | 13.3 | 400 x 20 |
20160804 | WASP-77 A b | 10.3 | 383 x 20 |
20160807 | WASP-124 b | 12.7 | 407 x 20 |
20160807 | QATAR-2 b | 13.3 | 220 x 20 |
20160809 | WASP-46 b | 12.9 | 350 x2 0 |
20160811 | QATAR-2 b | 13.3 | 256 x 20 |
20160904 | HATS-23 b | 13.9 | 363 x 20 |
20170623 | TrES-1 b | 11.8 | 263 x 20 |
20170623 | HATS-18 b | 14.0 | 422 x 20 |
20170625 | HATS-23 b | 13.9 | 484 x 20 |
20170721 | GJ214 | 7.4 | 207 x 20 |
20170721 | HATS-28 b | 13.9 | 485 x 20 |
20170722 | HD 189733 b | 7.7 | 471 x 20 |
20170723 | COROT-2 b | 12.6 | 512 x 20 |
20170724 | WASP-46 b | 12.9 | 391 x 20 |
20170725 | COROT-2 b | 12.6 | 449 x 20 |
20170725 | WASP-77 A b | 10.3 | 442 x 20 |
20170726 | HATS-34 b | 13.9 | 370 x 20 |
20170729 | TrES-5 b | 13.7 | 373 x 20 |
20170730 | COROT-2 b | 12.6 | 493 x 20 |
20170819 | TrES-3 b | 12.4 | 319 x 20 |
20170820 | COROT-2 b | 12.6 | 200 x 20 |
20170823 | WASP-52 b | 12.0 | 448 x 20 |
20170824 | WASP-77 A b | 10.3 | 407 x 20 |
In this section we present the preliminary analyses of light curves associated to three exoplanets transits (WASP-80b, WASP-52b and WASP-77 A b) registered at OAUNI. A more complete analysis will be done individually in incoming reports.
In each case, a better precision in the measurements was obtained when the average of the two comparison stars is used in the differential photometry. In general, the selected comparison stars are the best compromise between choose stars with comparable magnitude to the host star and brilliant unsaturated stars on the FOV.
In order to enhance the photometric precision, a binned of two consecutive 20s measurements was performed. With this procedure the photometric signal-to noise ratio was optimized by √2 resulting in a better fit of the used transit model. In this work we used the EXOFAST [6] online fitting tool for transit light curves available in the Nasa Exoplanet Archive database[3]. In all cases it was assumed a circular orbit and the precision of the fitted parameters for the transit was computed using Markov chain Monte Carlo (MCMC [7]) analysis available by EXOFAST.
Finally, two different aperture radii were tested to compute the photometry. These radii were selected as two or three times the mean seeing value during the transit time. Again, the radius chosen is that which minimizes the root mean square (RMS) of residuals for the model fit. In all cases, except WASP-52 b, the aperture equals to three times the mean seeing yielded the better results. Considering the plate scale of our detector and the typical seeing in our site (~1.7”), the best aperture radius for photometry would result in ~5.1”. This value is important to note when possible contamination by a close neighborhood star can be present on the analysed star, as in WASP-77 A (see Sect. 3.3).
3.1 WASP-80 b
WASP-80 b [8] is a gas giant exoplanet that orbits a K-type star. The host star is smaller than the Sun in size (~57%) and mass (~60%). The mass planet is approximately half of Jupiter’s mass and a complete orbit around its host star takes 3.1 days. The distance from the host star to the planet is very short (0.0344 AU) which is approximately 1/11th of the distance of Mercury from Sun and 1/7th of the inner boundary of the habitable zone (0.234 AU[4] [9]). This close proximity to its host star makes WASP-80 b a hot Jupiter exoplanet. The host star has a visual magnitude = 11.9 mag.
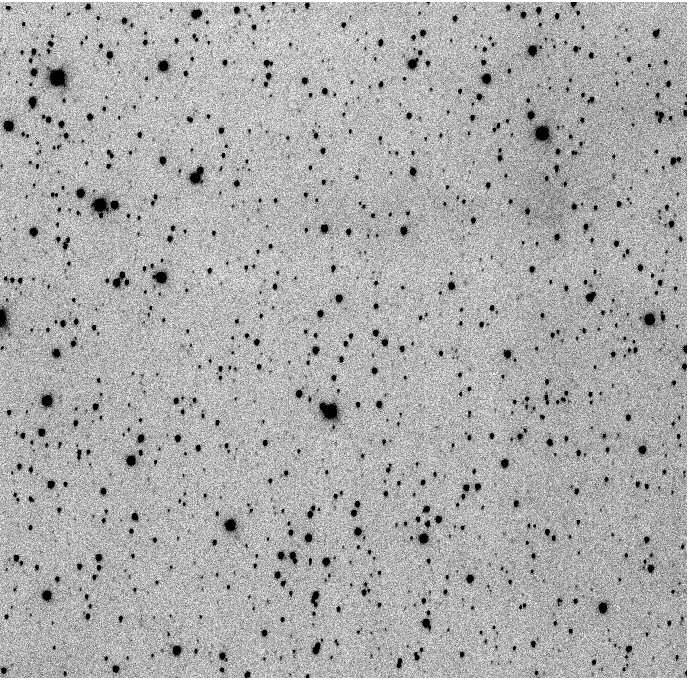
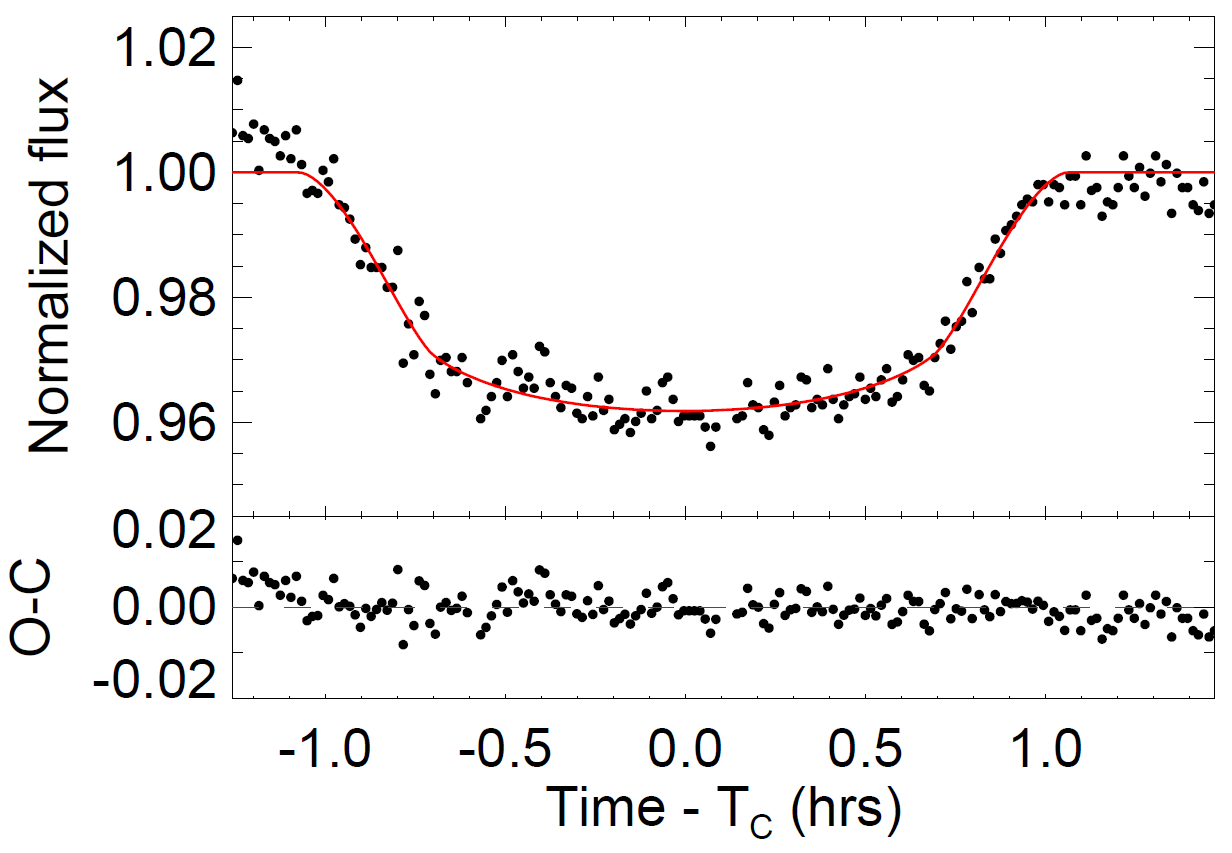
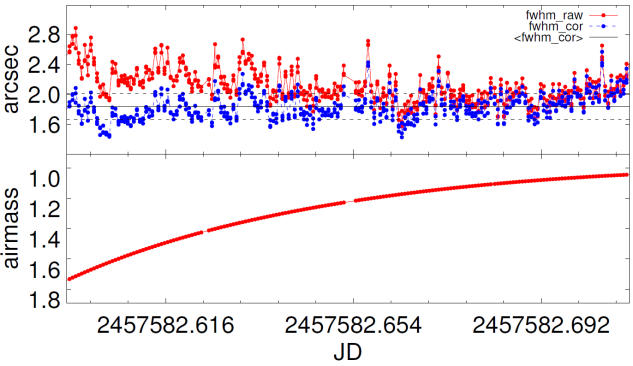
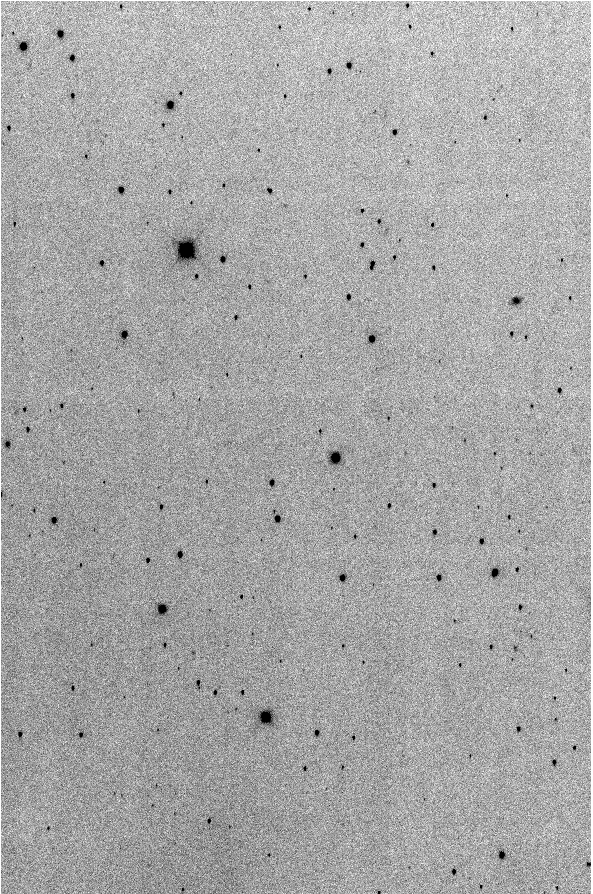
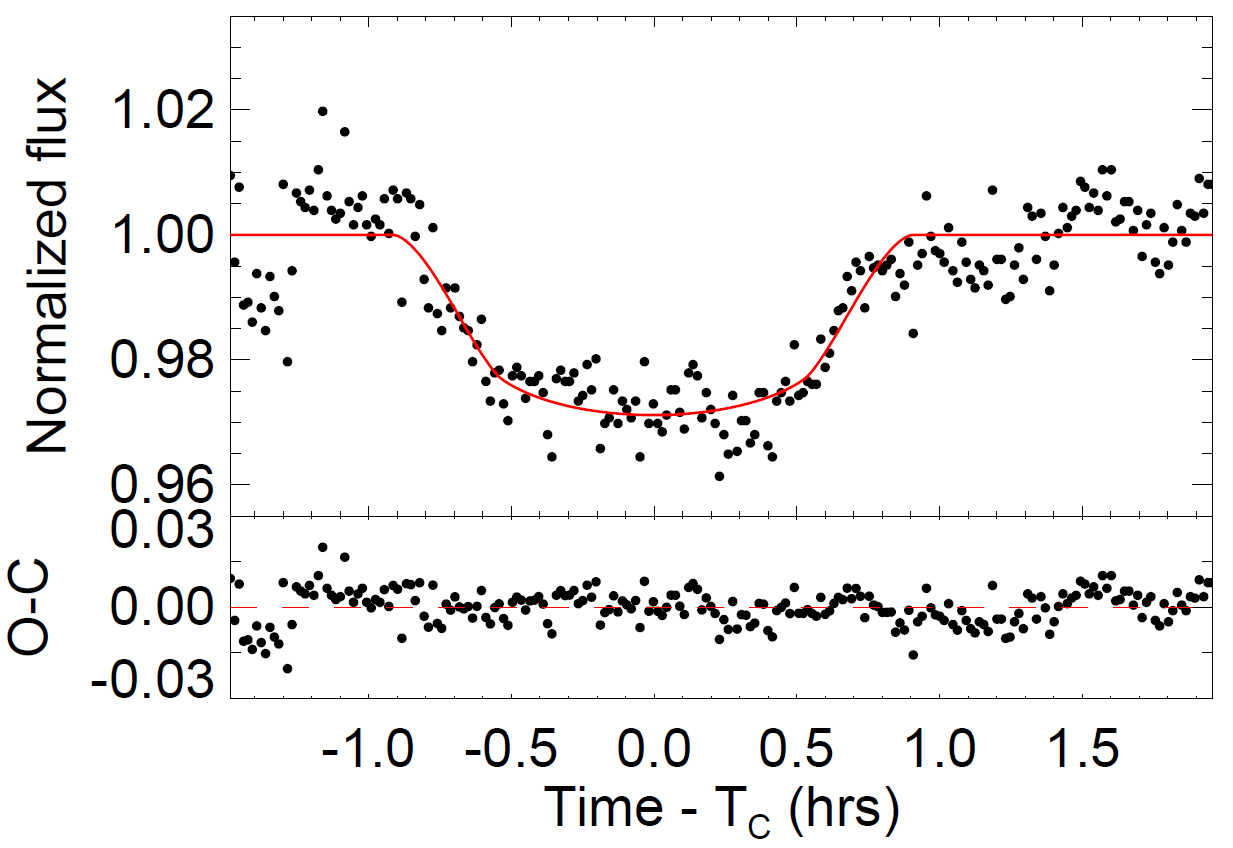
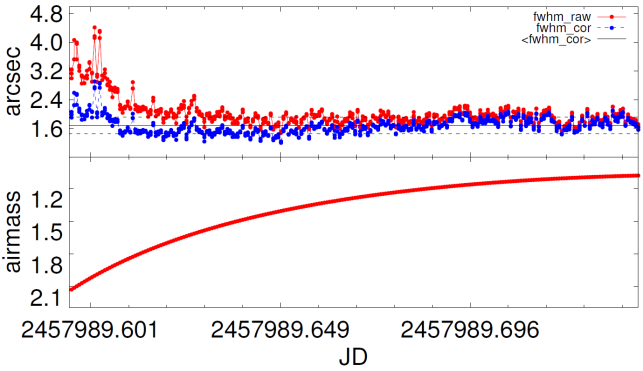
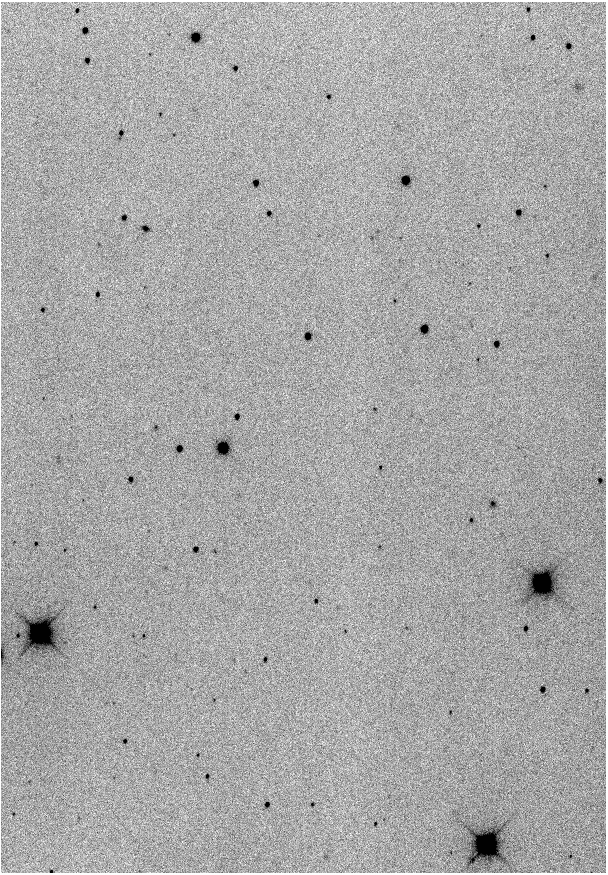
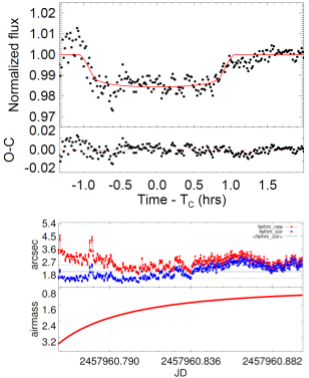
Figure 2a shows the FOV for WASP-80 b with the comparison stars used to compute its light curve. The stacked image is composed by 360 individual images covering 2h plus an overhead of ~0.5h. This total observation time (2.5h), let to record a complete transit considering that its expected duration is ~2.1h. The transit light curve along with the best EXOFAST model is shown in Figure 2b where the time is referenced about the central transit time (Tc). The observed minus computed (O-C) residuals are indicated in Figure 2c with a RMS lower than 0.4%. The transit depth is clearly detected being close to 3%. In terms of magnitudes the level of the transit detection is 39±5 mmag. The seeing measured along the transit is shown in Figure 2d with a mean value (corrected by airmass) of 1.9±0.2”. The transit was observed with the host star rising before its culmination as indicated in Figure 2e.
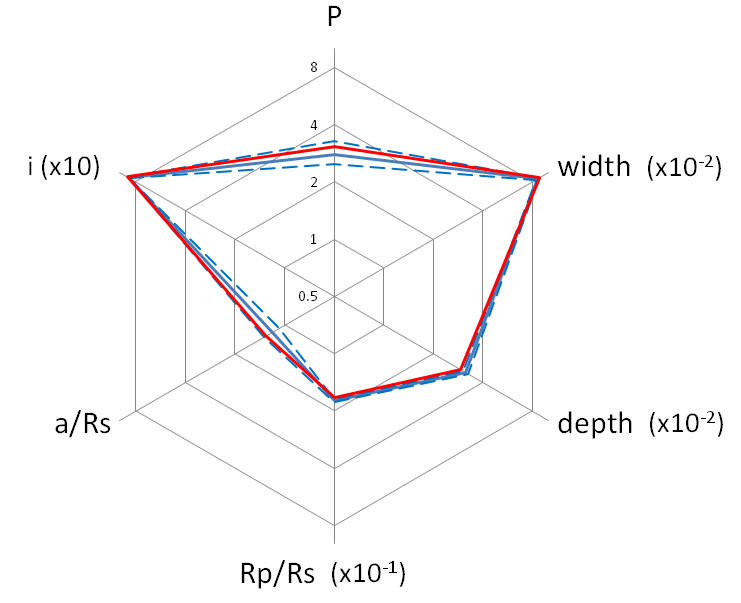
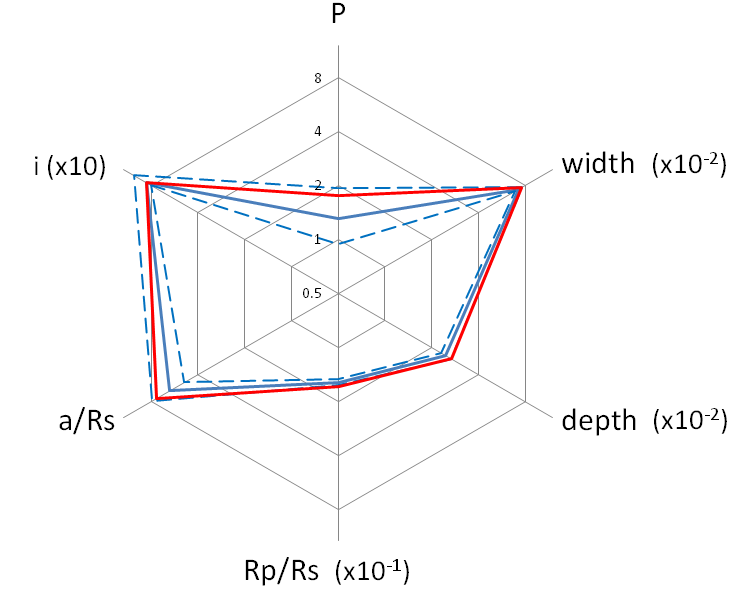
The main fitted parameters by the model are shown in Table 2 along with a comparison to the discovery values [8]. We show the computed values for the period (P), the transit duration (width), the transit depth about the normalized light curve, the radius of planet in stellar radii (Rp/Rs), the semi-major axis in stellar radii (a/Rs) and the inclination (i). The multi-parameter radial plot in Figure 3 helps to the comparison. In general, the fitted parameters are in a reasonable agreement with the discovery values being the period, the transit duration and the semi-major axis better constrained. It is interesting to note that first twelve minutes of our record was observed with high airmass and this fact played against a better determination of the top level before the transit.
Table 2. Fitted parameters for WASP-80 b.
Object | P (days) | width (days) | depth | Rp/Rs | a/Rs | i |
Wasp-80 b |
|
|
|
|
|
|
Ref. [8] |
|
|
|
|
|
|
In general, larger record times before the ingress and after the egress of transit are recommendable to facilitate a better determination of top level transit.
3.2 WASP-52 b
WASP-52 b [10] is also a gas giant exoplanet with half Jupiter mass orbiting its host star each 1.7 days. The distance of the planet from its host star is very close being just 0.0272 AU or 1/14th of the distance of Mercury from Sun. The inner boundary of the habitable zone (0.428 AU[5]) is also very far of the planet location. The host star is a G-type with V = 12.0 mag and similar to the Sun in radius (80%) and mass (87%). WASP-52 b is also considered a hot Jupiter exoplanet.
Table 3. Fitted parameters for WASP-52 b.
Object | P (days) | width (days) | depth | Rp/Rs | a/Rs | i |
Wasp-52 b |
|
|
|
|
|
|
Ref. [10] |
|
|
|
|
|
|
The FOV and light curve for WASP-52 b is shown in Figure 4. Its observed light curve composed of 448 individual images lasted 2.5h plus an overhead of ~1h = 3.5h. Considering the expected temporal width of transit (~1.8h), this time was enough for the detection.
The best EXOFAST fitting yielded an RMS of residuals lower than 0.6% and the transit depth is well detected being close to 2.5%. In this case, the magnitude level of detection was 32±7 mmag. The seeing during the transit was stable with a mean value corrected by airmass of 1.7±0.2”. In this case the beginning of the record was observed at very high airmass (> 1.9) with a high seeing dispersion on the first fifteen minutes. The main fitted parameters are compared with the discovery values [10] in Table 3 and Figure 5. The agreement is good being that the period, the transit duration, the semi-major axis and the inclination are consistent with the discovery values in one-sigma.
Table 4. Fitted parameters for WASP-77 A b.
Object | P (days) | width (days) | depth | Rp/Rs | a/Rs | i |
Wasp-52 b |
|
|
|
|
|
|
Ref. [11] |
|
|
|
|
|
|
3.3 WASP-77 A b
WASP-77 A b [11] is a hot Jupiter-class exoplanet closely orbiting a moderately bright G-type star which is part of a visual binary at only 3”. The exoplanet has a mass of 1.76 Jupiters and its orbital period is 1.4 days. The distance to its host star is only 0.024 AU or 1/16 of Mercury-Sun separation. This distance is much closer to the host star than the inner boundary of the habitable zone (0.626 AU[6]). The host star with visual magnitude = 10.3 mag is comparable to the Sun in mass and radius.
Figure 6 shows the FOV and light curve for WASP-77 A b. The registered light curve is composed by 442 individual images with a total observation interval of 2.5h plus an overhead of ~1h. This interval was enough to cover the expected transit duration (~2.2h) which is the longest of the three cases here analysed. The RMS of residuals for the best EXOFAST fitting is lower than 0.4% and high seeing dispersion was present in the first eighteen minutes observed at high airmass (> 2.4). The mean seeing corrected by airmass was 2.0±0.5” but it must be taken with care as representative at high airmass on the first section of the transit.
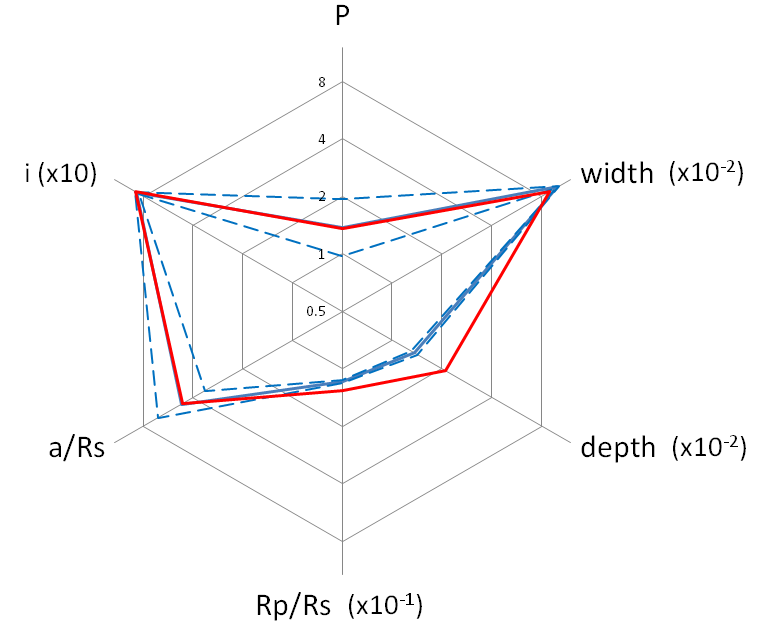
The comparison of the model parameters with the discovery values is shown in Table 4. The transit depth for WASP-77 A b is the lowest analysed in this work. The detection is positive but the transit depth (1.4%) is not consistent with the discovery value (2.1%). However, this detection limit represents only 17±4 mmag and is important to identify it because can tell us what is our overall detection limit for exoplanet transits using our setup. The multi-parameter radial plot is shown in Figure 7. We found better fittings for the period, the semi-major axis and the inclination. In particular, contamination of the close visual pair inside the used aperture radius (r=8.2”) must be play against a better determination of the model. This point will be explored in a future work for this special case.
We show the observational measurements associated to the OAUNI exoplanet transit program during the 2016 and 2017 campaigns at Huancayo site. Seventeen transits were registered and six of them more than one time. WASP-52 b and HATS-32 b were observed two times, WASP-77 A b and QATAR-2 b three times, and WASP-46 b and COROT-2 b four times.
As examples of the gathered results we show preliminary reductions and analysis of three positive exoplanet detections (WASP-80 b, WASP 52 b and WASP-77 A b). A fitting model was applied in each recorded transit and physical parameters were computed for the systems. In general, the agreement with the discovery values is good showing the feasibility of exoplanet transit detection with the available OAUNI setup. About this point, a detection limit as low as 17 mmag (as in WASP-77 A b) for a exoplanet transit is possible to achieve. A better determination of the proper aperture for photometry, expanding the possible radii, along with additional binning of the sample must help to enhance the precision of the fitted parameters by the model. This issue will be explored in our next works.
The detection of exoplanet transits showed here are the first measurements of its kind gathered by a peruvian astronomical facility. In this sense, these results help to support the continuity of the OAUNI exoplanet transit program on the next observational campaigns at Huancayo site.
ACKNOWLEDGEMENTS
The authors are grateful to the referees for their suggestions and comments. The authors are also grateful for the finantial support from The World Academy of Sciences (TWAS), Rectorate and the Instituto General de Investigación (IGI) at UNI, and Concytec (Convenio 102-2015 Fondecyt). We are grateful to the Huancayo Observatory staff for the logistic support. This paper makes use of EXOFAST (Eastman et al. 2013) as provided by the NASA Exoplanet Archive, which is operated by the California Institute of Technology, under contract with the National Aeronautics and Space Administration under the Exoplanet Exploration Program.
REFERENCES
[1] Pereyra A, Cori W, Meza E, Ricra J, Granda G 2012 REVCIUNI 15 1 p 209
[2] Pereyra A, Tello J, Meza E, Ricra J, Zevallos M 2015 REVCIUNI 18 1 p 4
[3] Nasa Exoplanet Archive. [Online]. 2019 Available from: https://exoplanetarchive.ipac.caltech.edu/exoplanetplots/.
[4] Stetson P 1987 PASP 99 p 191
[5] Stetson P 1992 in ASO Conf. Ser. 25 Astronomical Data Analysis Software, ed. D. M. Worrall, et al. (San Francisco, CA: ASP), p 297
[6] Eastman J, Gaudi B, Agol E 2013 PASP 125 p 83
[7] Ford E 2005 AJ 129 p 1706
[8] Triaud A, et al. 2013 A&A 551 id. A80
[9] Kopparapu R, et al. 2013 ApJ 765 p 131
[10] Hébrard G, et al. 2013 A&A 549 A134
[11] Maxted P, et al. 2013 PASP 125 p 48
Figure 1. Observed hours for exoplanet transits at OAUNI during 2016-2017 campaigns
Figure 2. WASP-80 b transit observed at OAUNI on 2016/07/12. a) Stacked image (IT = 360x20s = 2h + overhead). The FOV shown is 13.9’ x 13.6’. North is up and East is left. The position of WASP-80 is highlighted along with the comparison stars (C1 and C2); b) Transit light curve (black dots) binned (x2) and using an aperture radius = 3 x <seeing>. The best fitting model is also shown (red line). The time in abscissa is indicated with respect the central time (Tc) for transit; c) The residuals “Observed-Computed” from (b) are shown (black dots) along with the mean value (red dashed line); d) Seeing during the transit for raw (red dots) and corrected (blue dots) values. The mean corrected seeing value (black line) is indicated along with the one-sigma dispersion (dotted line). The abscissa is in heliocentric Julian date; e) Airmass during the transit. Wasp-80 was observed before its culmination.
Figure 3. Comparison between the fitted parameters (blue line) and discovery values (red line) for WASP-80 b. The units of each parameter are as in Table 2. Each axis is in a logarithm scale. The dashed lines represent the error on the fitted parameters.
Figure 4. WASP-52 b transit observed at OAUNI on 2017/08/23. Same as Fig. 3. a) Stacked image (IT = 448x20s = 2.5 + overhead). The FOV shown is 14.3’ x 21.6’. b) Binning (x2) and aperture radius = 2 x <seeing>.
Figure 5. Idem as Fig. 3 for WASP-52 b.
Figure 7. Idem as Fig. 3 for WASP-77 A b.
Figure 6. WASP-77 A b transit observed at OAUNI on 2017/07/25. Same as Fig. 3. a) Stacked image (IT = 442x20s = 2.5 + overhead). The FOV shown is 13.6’ x 19.5’. b) Binning (x2) and aperture radius = 3 x <seeing>.
Los artículos publicados por TECNIA pueden ser compartidos a través de la licencia Creative Commons: CC BY-NC-ND 2.5 Perú. Permisos lejos de este alcance pueden ser consultados a través del correo revistas@uni.edu.pe |
DOI: https://doi.org/10.21754/tecnia.v29i1.619 Revista TECNIA Vol. 29 N°1 Enero-Junio 2019
[1] STXL-6303E manufactured by SBIG
[2] IRAF is distributed by the National Optical Astronomy Observatory, which is operated by the Association of Universities for Research in Astronomy, Inc., under cooperative agreement with the National Science Foundation
[3] https://exoplanetarchive.ipac.caltech.edu/cgi-bin/ExoFAST/nph-exofast
[4] http://www.exoplanetkyoto.org/exohtml/WASP-80.html
[5] http://www.exoplanetkyoto.org/exohtml/WASP-52.html
[6] http://www.exoplanetkyoto.org/exohtml/WASP-77A.html