Stellar clusters multicolor photometry
at OAUNI
Fotometría multicolor de cúmulos estelares
en el OAUNI
Antonio Pereyra 1,2*, María Isela Zevallos 2
1 Instituto Geofísico del Perú, Área Astronomía, Badajoz 169, Ate, Lima, Perú
2 Facultad de Ciencias, Universidad Nacional de Ingeniería, Av. Túpac Amaru 210, Rímac, Lima, Perú
Recibido (Received): 30 / 01 / 2019 Aceptado (Accepted): 31/ 05 / 2019
ABSTRACT
In this work we present preliminary analysis of the astronomical photometry program for stellar clusters observed at OAUNI on the last years. Up to date twelve open clusters and nine globular clusters have been observed, in general, in more than one broadband filter. Multicolor photometry for selected clusters is shown along with a color-magnitude diagram for one open cluster. These measurements are the first ones of their kind collected by a peruvian astronomical facility.
Keywords: photometry, stellar clusters, open clusters, globular clusters, color-magnitude diagram
RESUMEN
En este reporte presentamos los análisis preliminares del programa de fotometría astronómica de cúmulos estelares desarrollado en el Observatorio Astronómico de la Universidad Nacional de Ingeniería (OAUNI) durante los últimos años. A la fecha, doce cúmulos abiertos y nueve cúmulos globulares han sido observados, en general, en más de un filtro banda ancha. Se muestra la fotometría multicolor de algunos cúmulos seleccionados y un diagrama color-magnitud para un cúmulo abierto. Estas medidas son las primeras de su tipo a ser realizadas con datos recogidos desde una facilidad astronómica en suelo peruano.
Palabras clave: fotometría, cúmulos estelares, cúmulos abiertos, cúmulos globulares, diagrama color-magnitud
INTRODUCTION
The National University of Engineering (UNI in spanish) operates an astronomical observatory at Huancayo - OAUNI [1], [2]. This facility has allowed the development of the peruvian astronomy in a professional way with several ongoing scientific programs. The photometric monitoring of stellar clusters has received special attention in the last years. The OAUNI instrumentation is enough to gather good quality photometry measurements for this program. This fact allowed to start stellar evolution studies in stellar clusters using the appropriate color-magnitude diagrams for these systems.
_________________________
* Corresponding author:
E-mail: apereyra@igp.gob.pe
The astronomical photometry applied to stellar clusters is important because physical parameters can be properly characterized as age and metallicity[1]. The next section explains the basic properties of these systems and their astrophysical importance.
- Stellar clusters
Stellar clusters are group of bound physically stars sharing a common movement inside the galaxy. The gravitation attraction between their star components maintains the grouping associated temporal or permanently. The first case corresponds to open clusters where it is possible visually to distinguish individual members. In turn, it is more difficult in the case of the globular clusters because their high central stellar content, when modest optical facilities are used[2].
- Open clusters
The open clusters usually contain between tens to a several hundredths of stars and tend to a gradual dispersion caused by the kinetic energy of their members, differential rotation of our Galaxy and/or external gravitational disturbances. Typical ages for open clusters ranging between few tens of million years (myr) to few hundredths of myr [3]. The open clusters are located on the disc of our Galaxy and their stars are enriched in heavy elements characteristic of young population stars [4].
The main sequence of open clusters generally is located in the same region on the color-magnitude diagram because the original material has not change to much since their formation. Therefore, the initial chemical composition of the open clusters is practically constant since their formation. The young open clusters have a main sequence covering brighter and hotter stars with early spectral types. Usually it is possible to see the locus where the main sequence ends and turns it to the giant branch (turn-off point). This point is age depending and it a very important tool for stellar evolution studies. As rule, if an open cluster is older, the main sequence is lower with the turn-off point redder and less bright [5], [6], [7].
- Globular clusters
The globular clusters are more massive systems typically between hundreds of thousands and millions of stars. Their stellar distribution is spherically symmetric with central densities almost ten times higher than in open clusters. The globular cluster stars are between the oldest stars in our Galaxy and also are important in stellar evolution studies [8].
There are known about two hundredth of globular clusters in our Galaxy located in its halo. The vast majority of them present a low content in heavy metals which is a typical characteristic of older population stars. Their color-magnitude diagram has a main sequence with only red stars, a large giant branch and very clear asymptotic branches. The size of the main sequence is shorter than the case of the open clusters because the globular clusters are older. Typical ages for globular clusters are tens of billions of years (1010 yr).
2. OBSERVATIONS AND REDUCTIONS
The observations were performed using the 0.5m OAUNI telescope [2] at Huancayo during the 2015 commissioning phase and the regular 2016-2018 observations campaigns. All the targets are Galactic systems and were selected considering to test the available instrumental capabilities during the proper observational windows on the campaigns. The measurements were gathered using the Johnson-Cousins BVRI filters. A front-illuminated CCD[3] with 3072x2048 pixels and 9µm/pixel was used as detector. The focal ratio f/8.2 of the scope yields a plate scale of 0.45”/pixel and a field-of-view (FOV) of 23’x15’.
In this work we show the actual status of the stellar cluster program observed at OAUNI and preliminary reductions using the photometry technique. All the images were reduced using IRAF[4] with typical calibration corrections of dark current and flatfield. Special IRAF routines were used to align the sequences of images and aperture photometry (DAOPHOT) was ostensibly used. The results presented here confirm previous photometric studies about the precision reached with the OAUNI detector [9].
The observation log for the 2015 and 2016-2018 campaigns is shown in Tables 1 and 2, respectively. The observation date using the format yyyymmdd is indicated in Col. (1) with the cluster name in Col. (2). The cluster type (open or globular) is shown in Col. (3). The filter used in each observation is in indicated in Col. (4) with the measurement number of the sequences in Col. (5) and the integration time by individual measurement in Col. (6). In general, the clusters were observed in two or three filters consecutively, in order to generate the corresponding color-magnitude diagrams.
Tables 1 and 2 list all the up-to-date measurements of the OAUNI stellar cluster program. They are more than 2500 individual measurements with 70% of them (approx. 1800) correspond to open clusters and the rest to globular clusters. Considering the useful observational hours, the open clusters were observed about 8.8h and the globular clusters around 4.4h (Figure 1).
Table 1. 2015 observation log |
Date | object | type | filter | N | IT (s) |
20150613 | NGC 4755 | open | B | 60 | 1 |
20150613 | NGC 4755 | open | I | 60 | 1 |
20150613 | NGC 4755 | open | R | 60 | 1 |
20150613 | NGC 4755 | open | V | 60 | 1 |
20150613 | NGC 5139 | globular | B | 2 | 10 |
20150613 | NGC 5139 | globular | R | 2 | 5 |
20150613 | NGC 5139 | globular | V | 60 | 1 |
20150613 | NGC 5139 | globular | V | 2 | 5 |
20150613 | NGC 3766 | open | V | 5 | 1 |
20150613 | NGC 3766 | open | V | 3 | 5 |
20150613 | NGC 3766 | open | V | 5 | 1 |
20150613 | NGC 3766 | open | B | 5 | 1 |
20150613 | NGC 3766 | open | B | 5 | 5 |
20150613 | NGC 3766 | open | R | 5 | 1 |
20150613 | NGC 3766 | open | R | 5 | 5 |
20150716 | NGC 6281 | open | B | 36 | 5 |
20150716 | NGC 6281 | open | I | 24 | 5 |
20150716 | NGC 6281 | open | R | 24 | 5 |
20150716 | NGC 6121 | globular | B | 36 | 5 |
20150716 | NGC 6121 | globular | R | 36 | 5 |
20150716 | NGC 6121 | globular | V | 36 | 5 |
20150719 | NGC 6809 | globular | B | 15 | 20 |
20150719 | NGC 6809 | globular | R | 15 | 20 |
20150719 | NGC 6809 | globular | V | 15 | 20 |
20150719 | NGC 6864 | globular | B | 15 | 20 |
20150719 | NGC 6864 | globular | R | 15 | 20 |
20150719 | NGC 6864 | globular | V | 15 | 20 |
20150719 | NGC 6192 | open | B | 15 | 20 |
20150719 | NGC 6192 | open | R | 15 | 20 |
20150719 | NGC 6192 | open | V | 15 | 20 |
20150719 | NGC 6250 | open | B | 15 | 20 |
20150719 | NGC 6250 | open | R | 5 | 5 |
20150719 | NGC 6250 | open | R | 9 | 20 |
20150719 | NGC 6250 | open | V | 9 | 20 |
20150719 | NGC 6259 | open | B | 15 | 20 |
20150719 | NGC 6259 | open | R | 15 | 20 |
20150719 | NGC 6259 | open | V | 15 | 20 |
20150719 | NGC 6752 | globular | B | 15 | 20 |
20150719 | NGC 6752 | globular | R | 15 | 20 |
20150719 | NGC 6752 | globular | V | 15 | 20 |
20150719 | NGC 6981 | globular | B | 15 | 20 |
20150719 | NGC 6981 | globular | R | 15 | 20 |
20150719 | NGC 6981 | globular | V | 15 | 20 |
3. ANALYSIS
3.1 About the photometric precision
Since the construction of color-magnitude diagrams for stellar cluster implies to optimize the available photometric precision, in the following we will try to quantify the actual precision reached by the OAUNI measurements.
Depending how brilliant is a cluster the integration time must be adjusted in order to avoid saturation of the brightest stars and also have a reasonable signal-to-noise ratio for the dimmer stars. The protocol used in this program was to use short integrations times up to twenty seconds by individual measurement constructing sequences of dozens of images of a given cluster. After that the sequences will be digitally stacked to enhance the signal-to-noise ratio on the final image.
Figure 2, for example, shows the monochromatic image on V filter for the open cluster NGC3766 after a stacking of three images of five seconds by individual integration time. The stacked fifteen-second image enhances the signal-to-noise ratio of the individual images by a  factor. In the case of NGC 3766, which has an apparent V magnitude of 5.3 mag[5], the short individual integration time avoids the saturation of their brightest component stars. Figure 3 shows the composite Red-Green-Blue (RGB) image for NGC 3766 constructed using the stacked B, V and R images. In particular, the total time for B image is larger (5x5s=25s) because the detector is less sensitive in this broadband.
Another example can be appointed on Figure 4 where the open cluster NGC 4755, which has an apparent V magnitude of 4.2 mag[6], was observed with a larger total integration of sixty seconds (60s = 60x1s) on V filter. The fact to use very short integrations times guarantees to avoid saturation considering that this cluster is still more brilliant than NGC 3766. Figure 5 shows the composite RGB image for NGC 4755 where the three broadband filters (B, V and R) use the same protocol for the total integration time (60x1s).
However, long integration times let us to observe dimmer clusters as in NGC 6192 (Figure 6) where a total IT of three hundredth seconds (15x20s) on V filter was used. This time makes possible to observe a more quantity of components considering that the apparent magnitude of this cluster is V=9 mag[7].
In order to quantify the enhanced photometric precision when the integration time is longer, we perform photometry on the individual stars present in the brightest (NGC 3766, Figure 2) and weakest (NGC 6192, Figure 6) open clusters considered in this work.
Figure 7 shows the photometry for the automatic selected stars using the IRAF routine DAOFIND on the NGC 3766 field (Figure 2). All the instrumental photometry measurements were calibrated to the standard astronomical photometric system using zero points calculated comparing the brightest stars on the field with photometric catalogs. For NGC 3766, we used the SIMBAD[8] database, and for NGC 6193 the photometry from [10].
In the following we select as comparison criteria a photometric precision of 0.1 mag (or its equivalent signal-to-noise ratio of 10). As expected, Figure 7 indicates that a more imprecise measurement (or larger error) is achieved as dimmer the star is. With this, the photometric precision of 0.1 mag is possible for a dimm star of 13.3 mag approximately when the total IT is five seconds.
For weak objects as in NGC 6192 (Figure 6), Figure 8 shows that a 0.1 mag precision can be achieved for stars as weak as 18 mag. In this case, the image corresponds to a total IT of 300s. From the above we can conclude that a good precision is possible with our available instrumental allowing to observe weak stars when appropriate long integration times are used.
The above quantification about the photometric precision is important because let us to know what integration times consider in order to generate appropriated color-magnitude diagrams with enough weak stars for a good visualization of, for example, the main sequence for a given cluster.
3.2 Color-magnitude diagram
As an example, in the following we generate a color-magnitude diagram using the multicolor photometry of the open cluster NGC 6192. This open cluster was previously studied using photoelectric [11] and CCD photometry [12], [13], [14].
Figures 6 and 9 shows NGC 6192 images on V and R filters, respectively, each one with total IT of 300s. In order to select stars with a higher probability of belonging to the cluster, we defined an internal cluster radius of 4.1’ consistent with a similar value used in previous works [11]. This exercise identified 198 stars indicated in Figure 9. After this, we proceeded to compute the photometry in both V and R broadband in order to construct the V-R color subtracting the second magnitude from the first one.
Figure 10 shows the color-magnitude (V vs V-R) diagram for NGC 6192. We can note that the magnitude range for the cluster components spread between 10.5 and 17.5 mag. This range is consistent with the V range in previous color-magnitude diagram for this cluster [14].
Since the total IT using in our measurements is 300s, we know that the intrinsic precision is lower than 0.1 mag (sec 3.1). This fact guarantees a precise position of each object in our color-magnitude diagram. On the other hand, the V-R color in Figure 10 indicates a typical range of one mag. It is interesting to note the well-defined main sequence and also the red giants branch. However, it is possible that a part of the selected objects do not belong physically to the cluster and, eventually, are foreground or background stars especially on the external borders of the selected area. An ongoing more detailed study will let to identify properly the real members of this cluster.
3.2 Globular clusters
An example of the globular clusters observed in this program is NGC 5987 shown in Figure 11. This cluster is weaker than the clusters showing previously. Its apparent magnitude is ~11.9 mag[9]. Due to this fact, the total integration time for this object is one of the longer ITs used. Figure 11 shows the NGC 5897 monochromatic image on V filter gathered with a total IT = 1000s = 50x20s. Additional sequences in other filters and with similar ITs also were acquired. Better precisions are expected allowing still to reach higher magnitudes in this object using our actual instrumental setup.
4. CONCLUSIONS
This report shows the current state of the astronomical observations gathered for the OAUNI scientific program of photometry stellar clusters during the 2015 commissioning phase and the regular 2016-2018 observational campaigns.
Up-to-date twelve open clusters and nine globular clusters have been observed, all of them in more than one filter resulting in more than twelve hours of observation.
This program allows us to quantify the photometric precision reached with the current instrumental available in this project. This will help to improve the preparation of future photometric programs at OAUNI.
The available photometric precision with our setup made possible to generate the first color-magnitude diagrams for open clusters with data gathered from an astronomical facility in Peru. This fact will let new publications about this issue which are already programmed.
Finally, this program has involved to youth students of under and post graduate from UNI allowing to reach one of the main primary aims of the OAUNI project respecting to disseminate astronomy and to produce thesis in this area.
ACKNOWLEDGEMENTS
The authors are grateful to the referees for their suggestions and comments. The authors are also grateful for the financial support from The World Academy of Sciences (TWAS), Rectorate and the Instituto General de Investigación (IGI) at UNI, and Concytec (Convenio 102-2015 Fondecyt). Finally, we are grateful to the Huancayo Observatory staff for the logistic support.
REFERNCES
[1] Pereyra A, Cori W, Meza E, Ricra J, Granda G 2012 REVCIUNI 15 1 p 209
[2] Pereyra A, Tello J, Meza E, Ricra J, Zevallos M 2015 REVCIUNI 18 1 p 4
[3] Kartunnen H, Kröger P, Oja H, Poutanen M, Donner KJ. 2007 Fundamental Astronomy (4rd edition) Springer p. 339
[4] Shu F. 1982 The Physical Universe. An Introduction to Astronomy University Science Books Sausalito CA p. 166
[5] Stromgren B 1933 Zeitschrift für Astrophysik 7 p 222
[6] Kuiper G 1936 Harvard College Observatory Bulletin 903 p 1-11
[7] Carrera R, et al. 2019 A&A 623 A80
[8] Kartunnen H, Kröger P, Oja H, Poutanen M, Donner K. 2007 Fundamental Astronomy (4rd edition) Springer p. 343
[9] Pereyra A, Zevallos M, Ricra J, Tello J 2016 TECNIA 26 2 p 20
[10] Paunzen E, Maitzen H, Rakos K, Schombert J 2003 A&A 403 p 937
[11] Kilambi GC, Fitzgerald MP 1983 Bulletin of the Astronomical Society of India 11 p 226
[12] King D 1987 Observatory 107 p 107
[13] Kjeldsen H, Frandsen S 1991 A&AS 87 p 119
[14] Paunzen E, Maitzen HM 2002 A&A 385 p 867
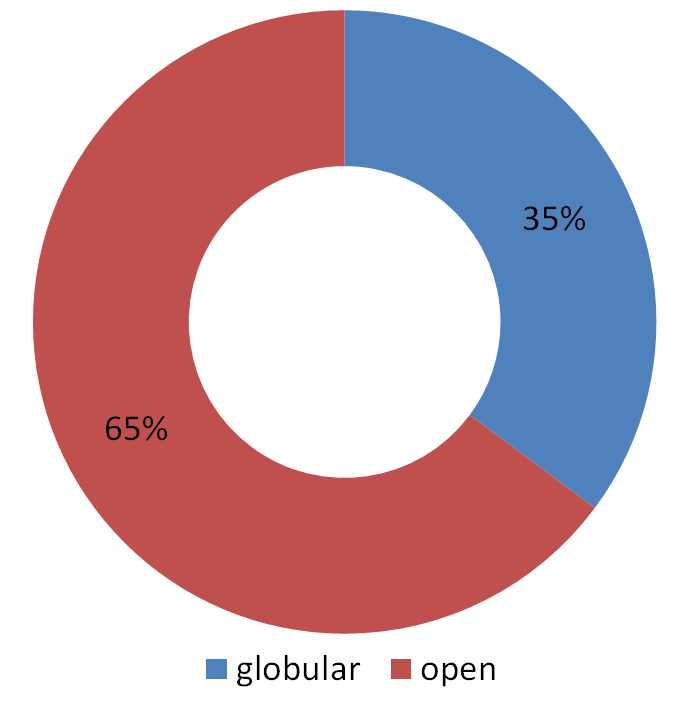
Figure 1. Observed hours at OAUNI during 2015-2018 campaigns for stellar clusters.
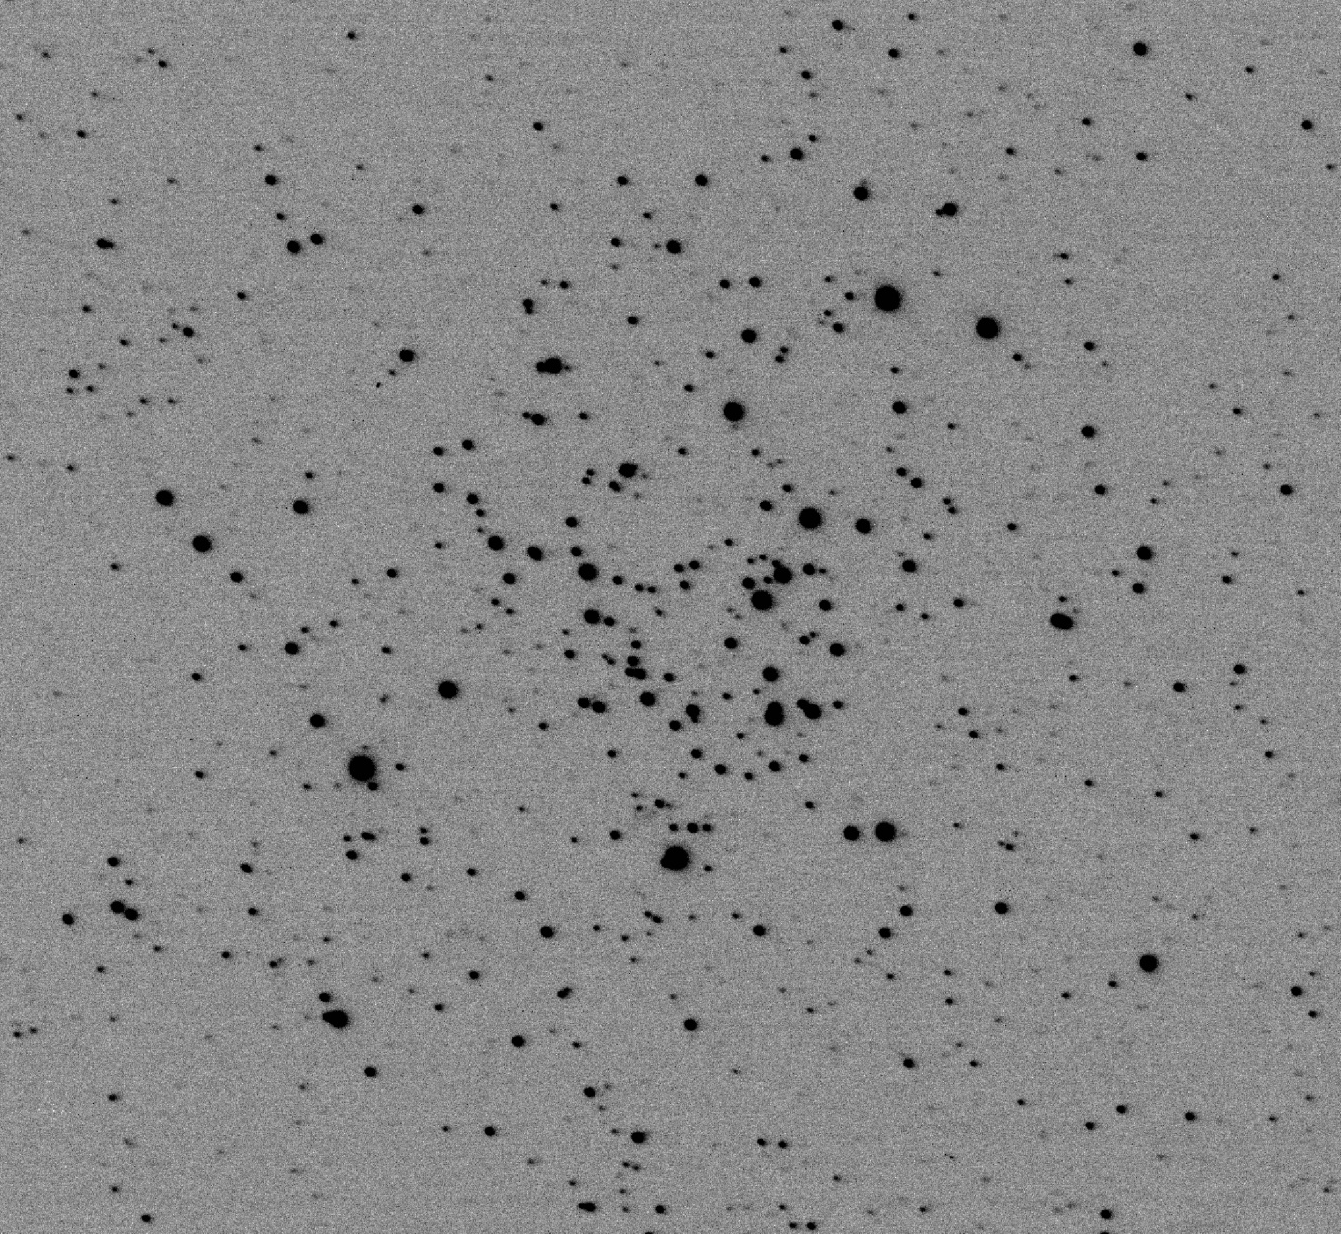
Figure 2. Open cluster NGC 3766 observed at OAUNI on 2015/06/13. Monochromatic image on V filter. IT = 3x5s = 15s. North is up and East is left.
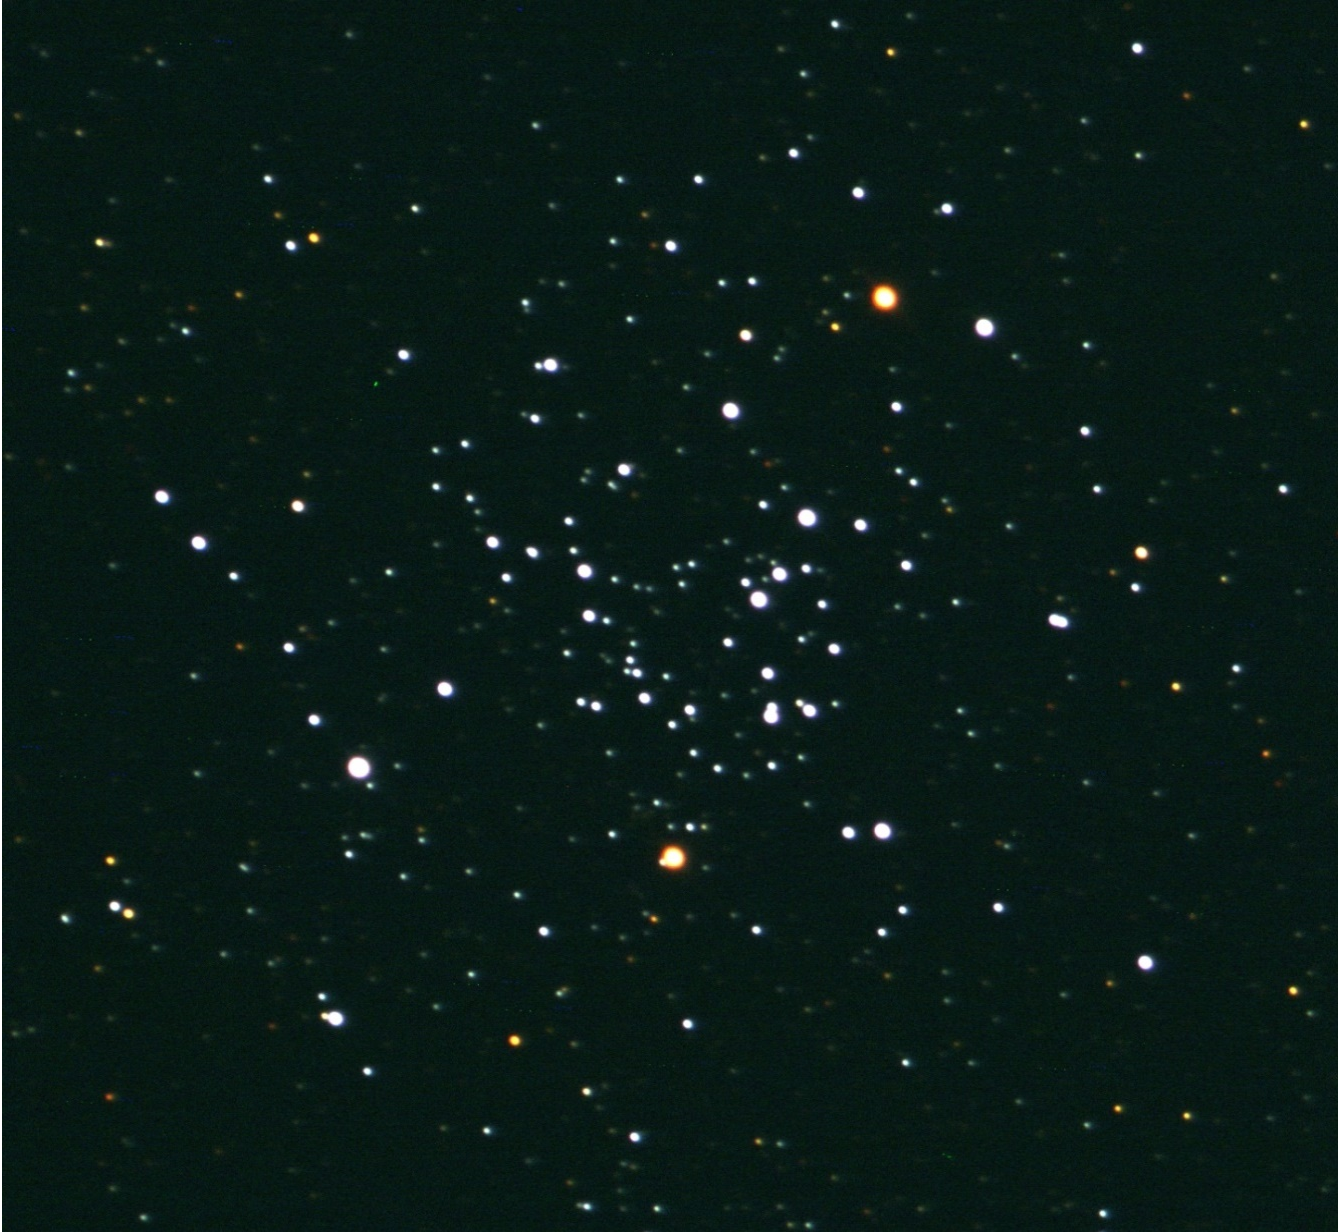
Figure 3. NGC 3766 composed RGB image (2015/06/13): B (5x5s) + V (3x5s) + R (5x5s). North is up and East is left.
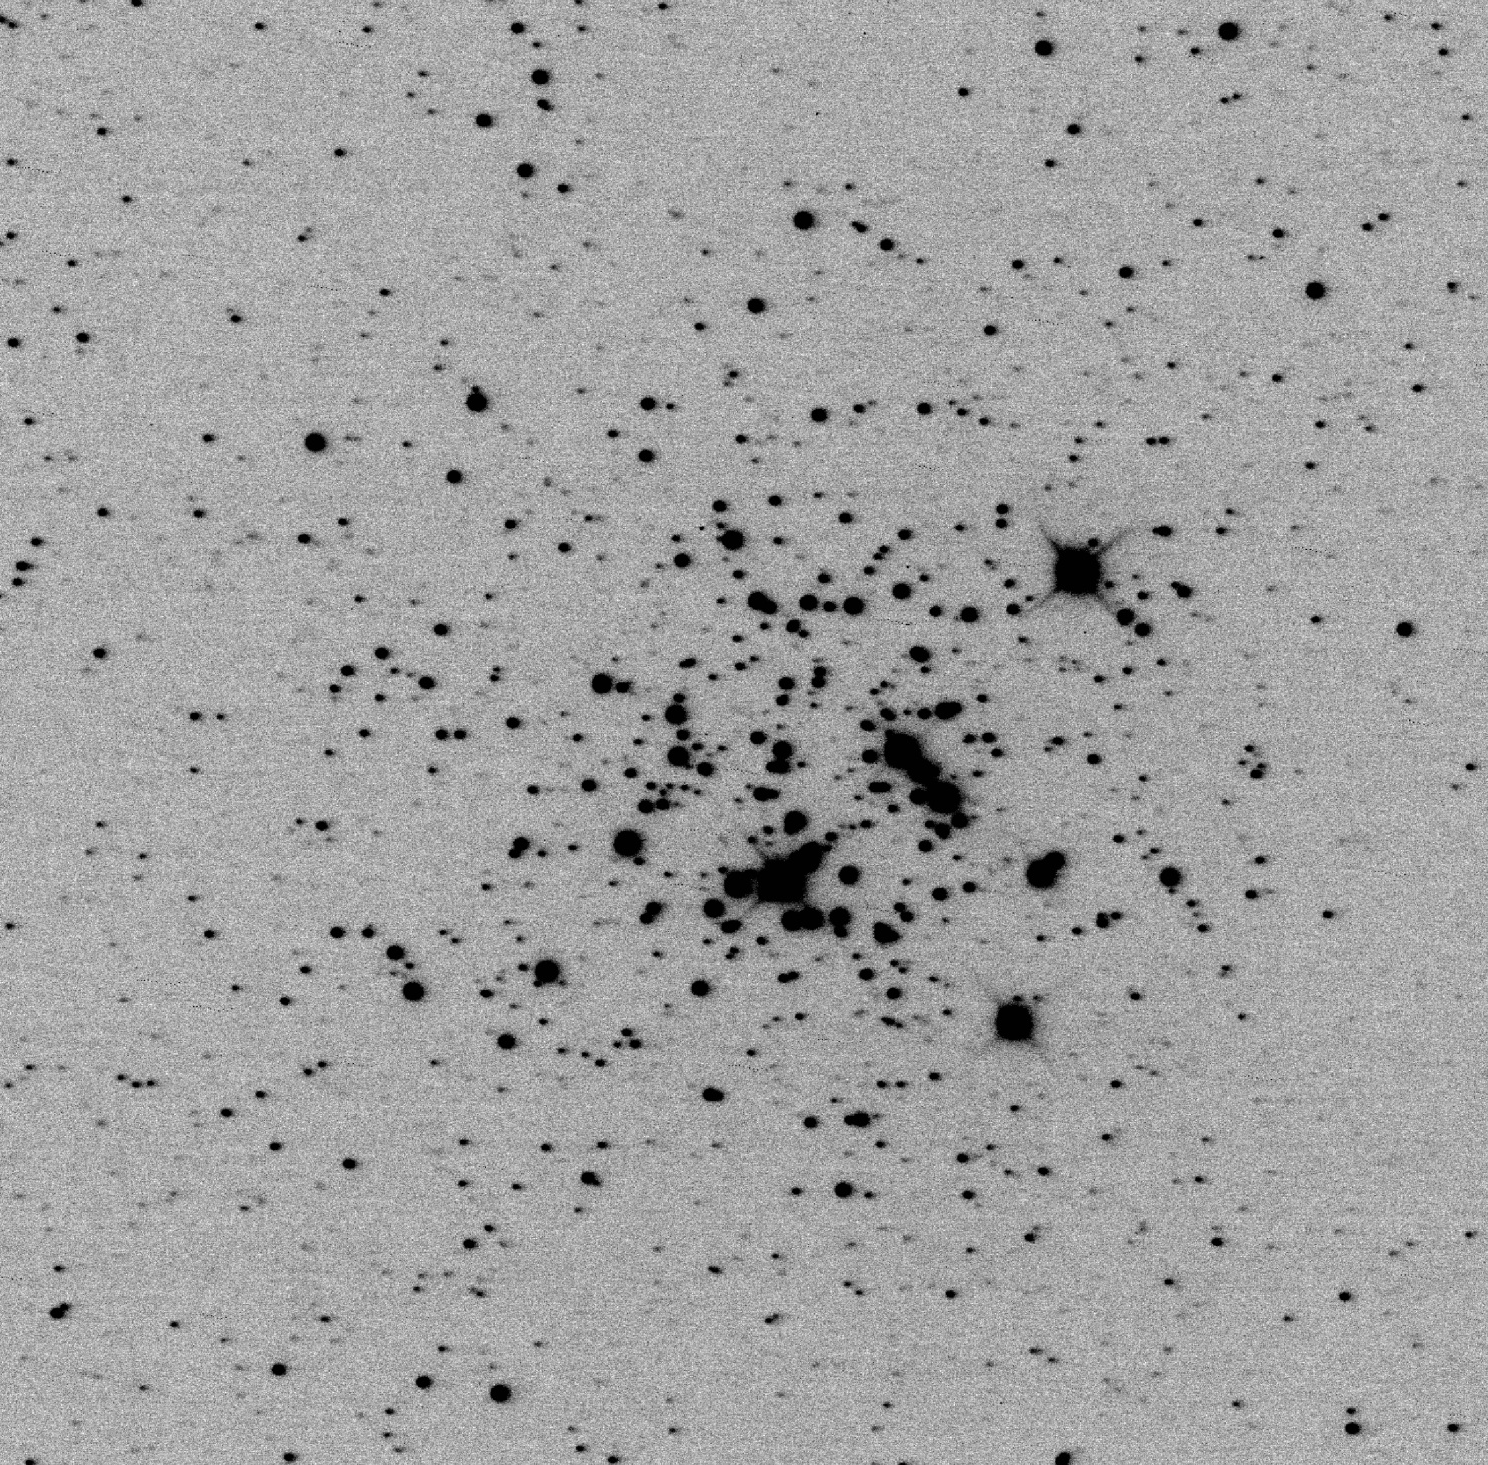
Figure 4. Open cluster NGC 4755 (Jewel Box) observed at OAUNI on 2015/06/13. Monochromatic image on V filter. IT = 60x1s = 60s.
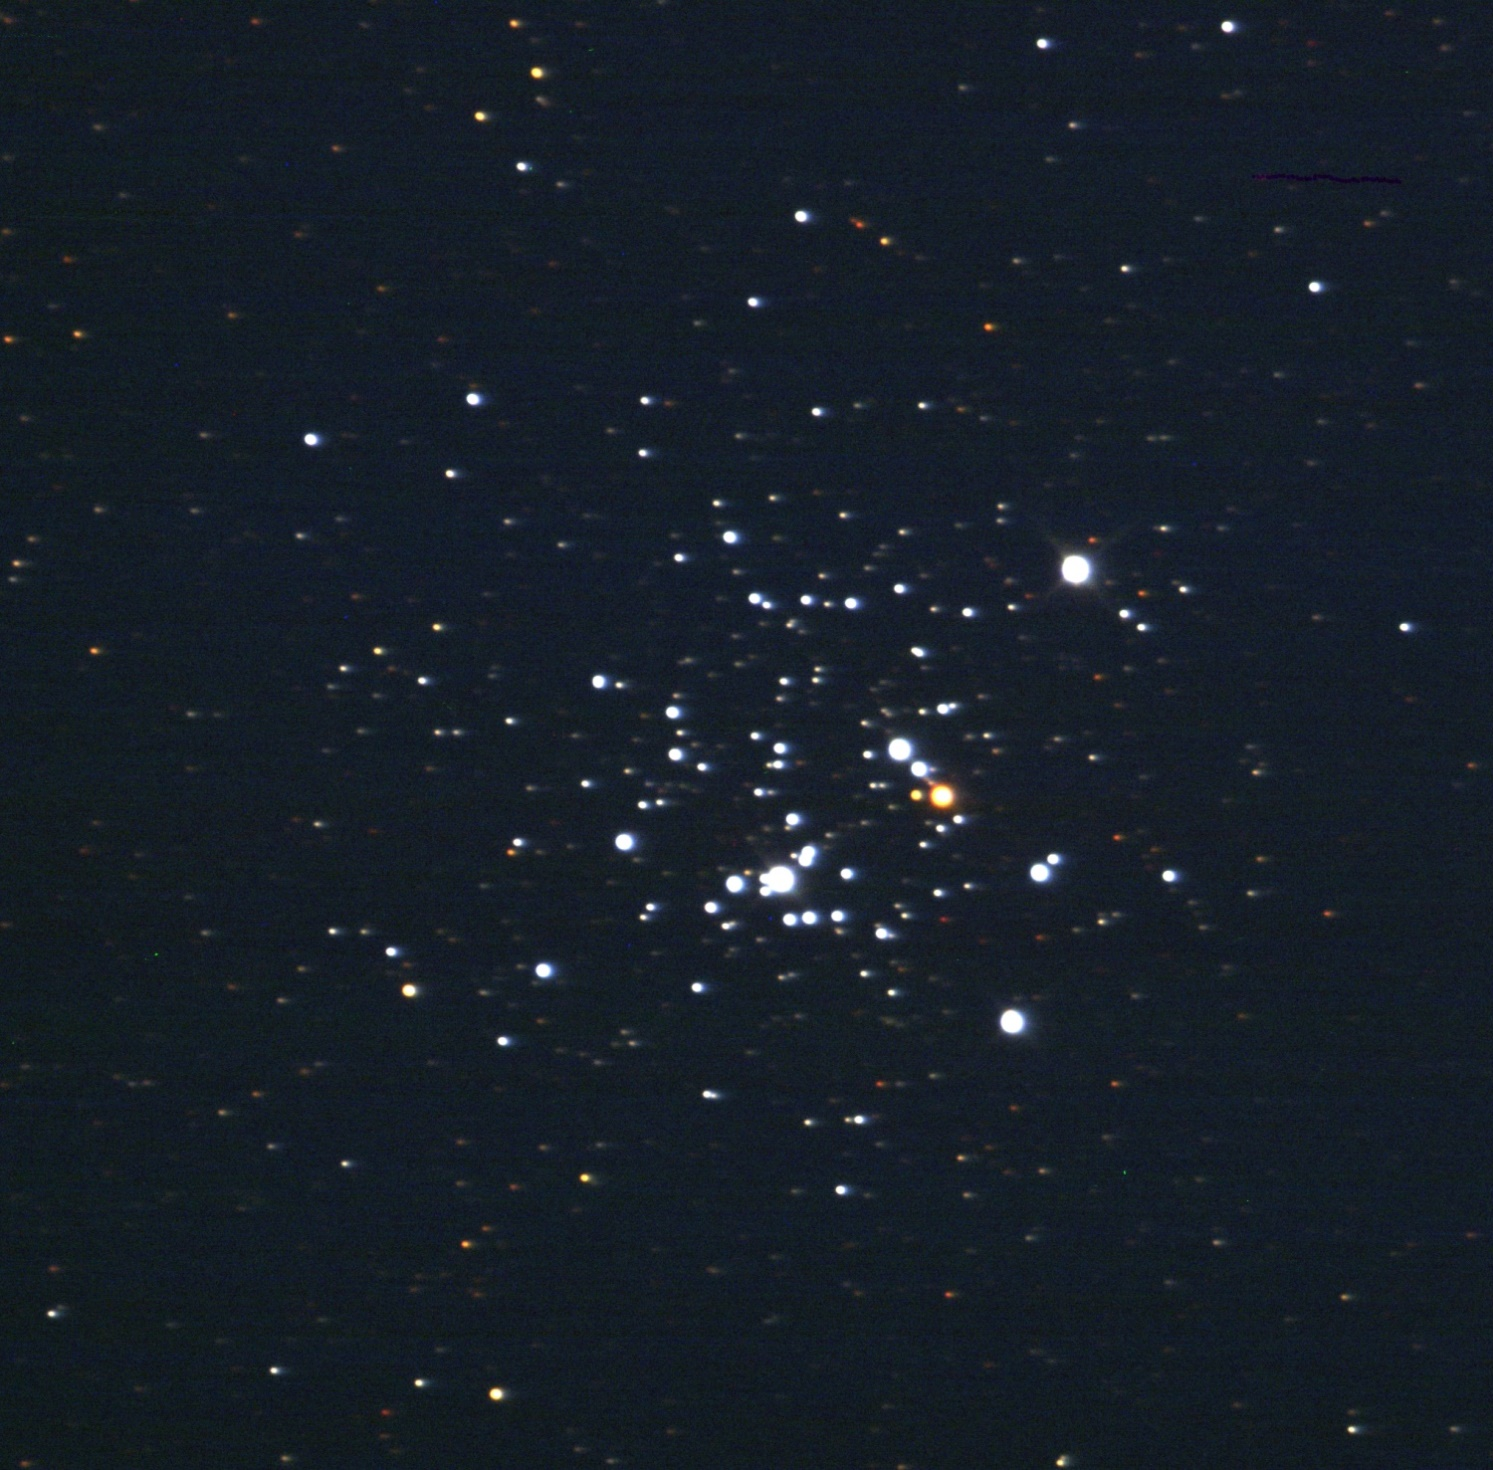
Figure 5. NGC 4755 composed RGB image (2015/06/13): B (60x1s) + V (60x1s) + R(60x1s). North is up and East is left.
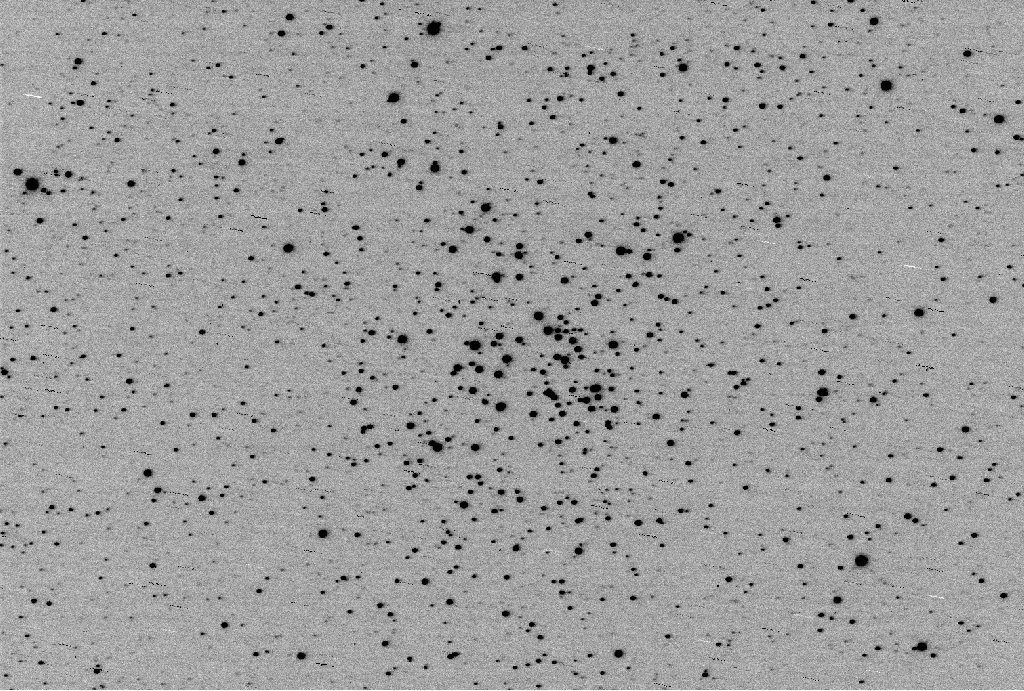
Figure 6. Open cluster NGC 6192 observed at OAUNI on 2015/07/19. Monochromatic image on V filter. IT= 15x20s. FOV = 15'x15'. North is up and East is left.
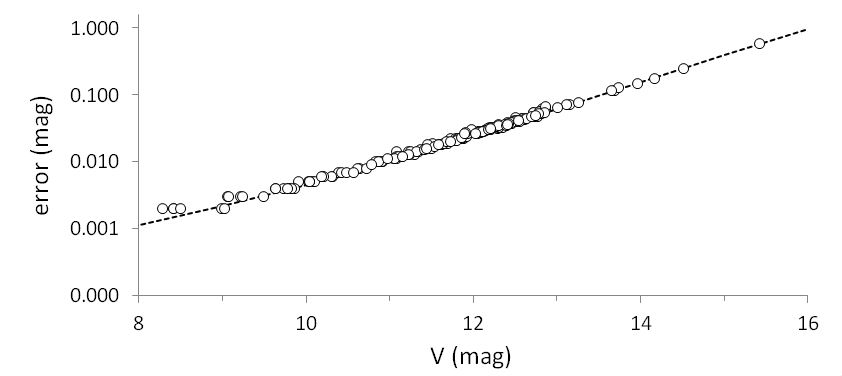
Figure 7. Photometric precision for field stars on NGC 3766 (Figure 2) showing a seeing model of 2.5" (dashed line). For an IT = 5s is achieved a photometric precision of 0.1 mag for stars with V=13.3 mag.
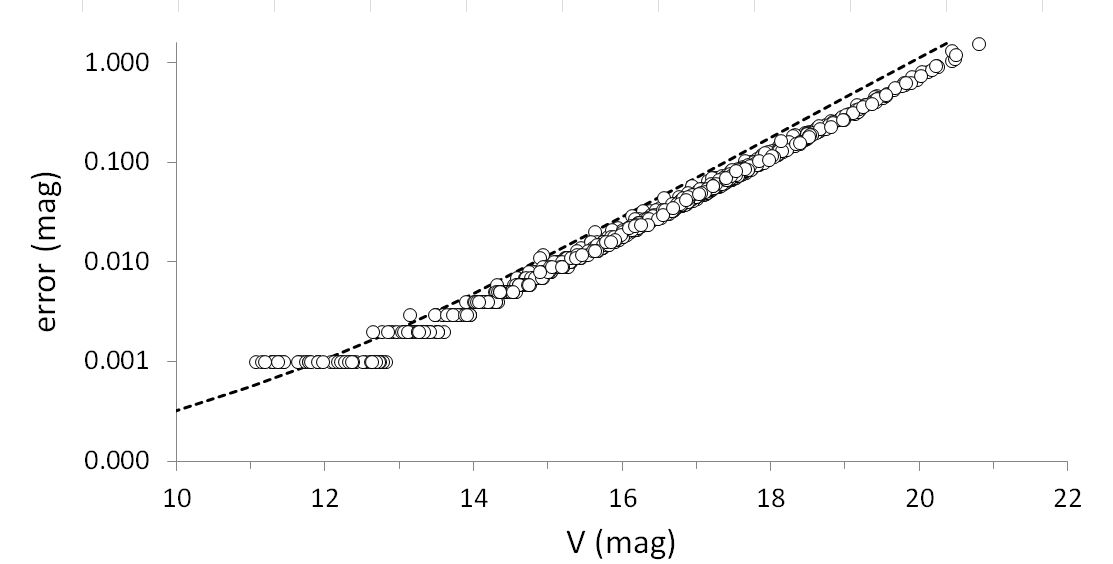
Figure 8. Photometric precision for field stars on NGC 6192 (Figure 6) showing a seeing model of 2.0" (dashed line). For an IT = 300s is achieved a photometric precision of 0.1 mag for stars with V=18 mag.
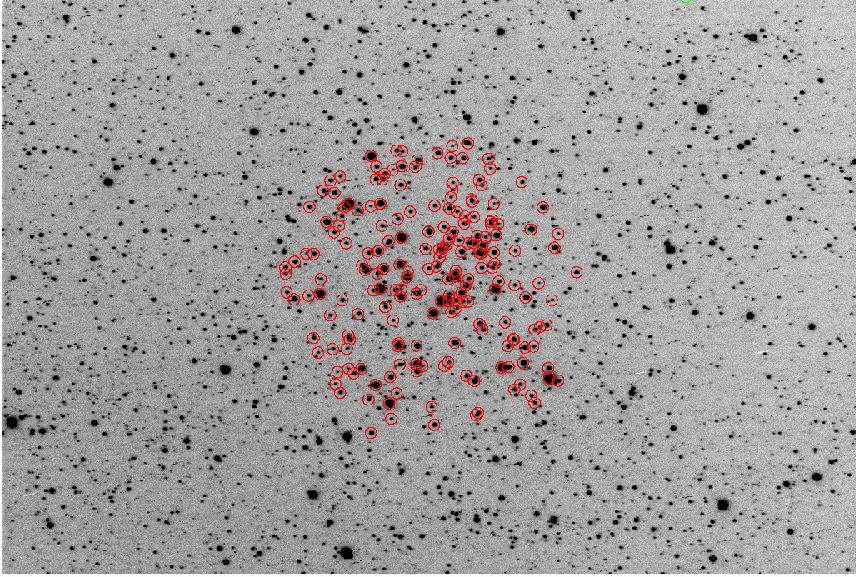
Figure 9. NGC 6192 filter R (IT=15x20s, same date as Figure 6) image showing selected stars (red circles) used to generate a color-magnitude diagram.
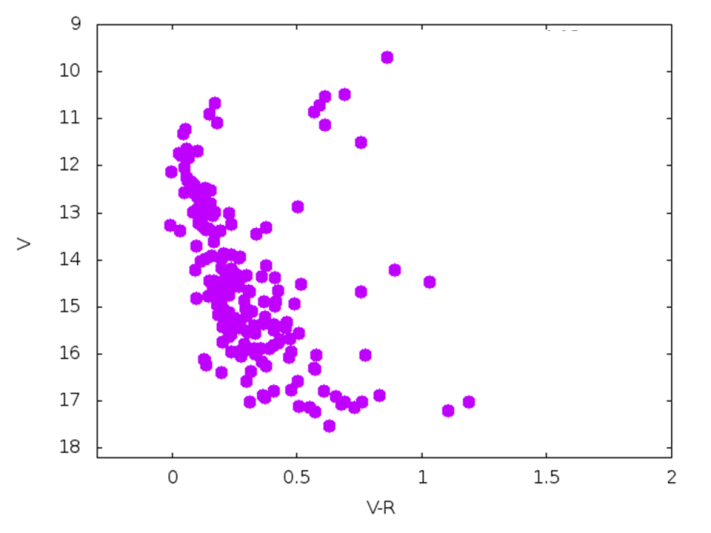
Figure 10. NGC 6192 color-magnitude (V-R vs V) diagram (Fig. 6 and 9) for stars in a 4.13’ radius.
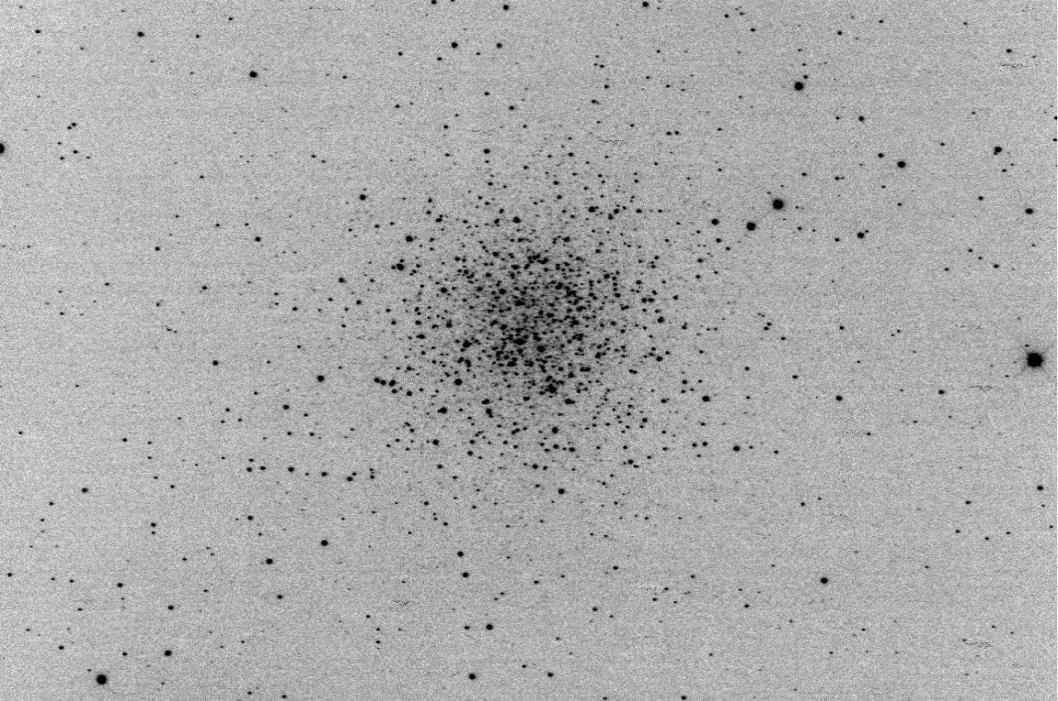
Figure 11. Globular cluster NGC 5897 observed at OAUNI on 2017/07/29. Monochromatic image on V filter. IT = 50x20s. FOV= 15'x15'.

| Los artículos publicados por TECNIA pueden ser compartidos a través de la licencia Creative Commons: CC BY-NC-ND 2.5 Perú. Permisos lejos de este alcance pueden ser consultados a través del correo revistas@uni.edu.pe |
DOI: https://doi.org/10.21754/tecnia.v29i1.610 Revista TECNIA Vol.29 N°1 Enero-Junio 2019
[9] SEDS database, http://spider.seds.org/ngc/revngcic.cgi?NGC5987